
Noah’s Ark: The Problem of Violent Waves
More than 40 people died when the MV Derbyshire was lost in a typhoon in the South China Sea in 1980. The 294 m Derbyshire had been at sea for only two years. An inquiry ruled that a hatch cover had failed as huge waves buffeted the 176,369-ton bulk carrier. Further research indicated the ship failed because the waves were the exact same length as the vessel. Dr. Janet Heffernan, who analyzed the wave patterns, explained,
If the wave is smaller than the ship, then the vessel can cope with it. If the wave is much bigger, then the ship bobs on top of the wave, but if the wave is the same length, then the ship picks up the frequency of the sea…” BBC article. Technical Report
How Big and How Bad?
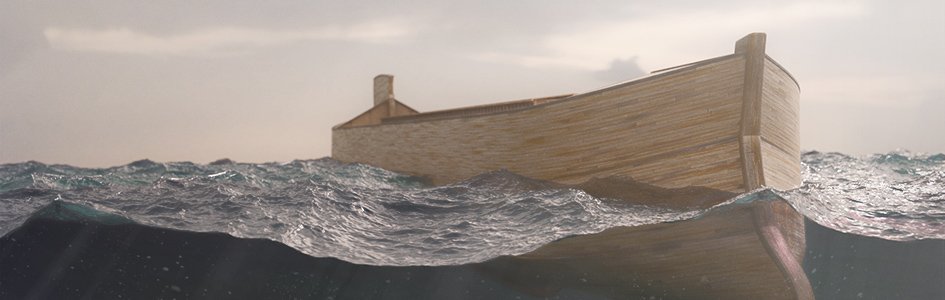
The size and nature of the waves during the deluge dictates the strength of the ark. The Hong et al. Korean safety study concluded that the ark was capable of riding out 30 m waves if the structure had 30 cm walls and 50 cm framing timbers. With stronger construction, the ark could survive 47.5 m waves before the water reaches the corner of the roof (heeling angle 31o). Such waves have never been recorded in the ocean today. The highest has been measured at 26 m in the notorious North Atlantic.
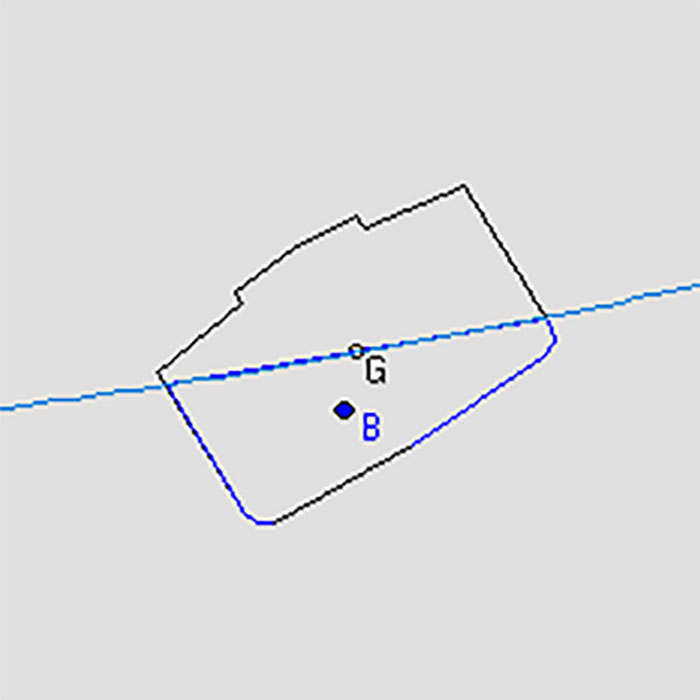
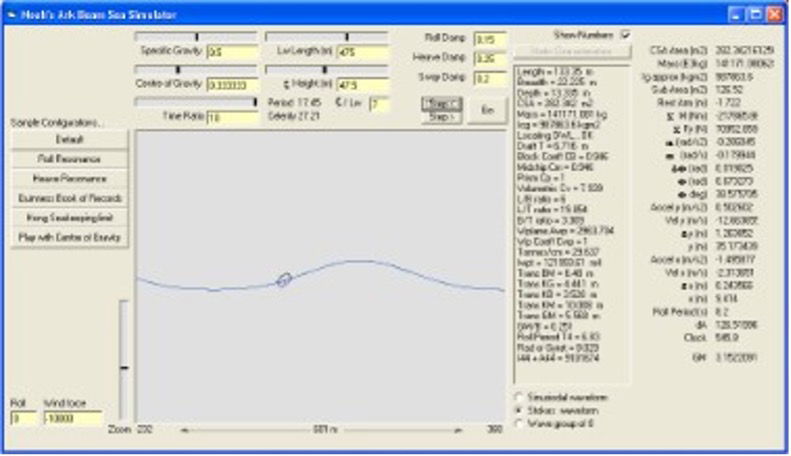
Figure 1. The ark in a beam sea (sideways to the incoming waves): This is the most dangerous state for a ship in high seas and could lead to capsize.
Wind-Generated Waves
Generation of wind waves of such magnitude would require a constant gale over a considerable distance (fetch). This is why waves are limited in a small lake. If the wind changes direction, the wave pattern can be reduced by interference with a new wave system. Generally speaking, strong winds are of relatively short duration, making very large waves a rare event.
Significant wave height (H1/3). The average wave height (from trough to crest) of the highest 1/3 (33%) of waves.
Thirty meters is a big wave, being a significant wave height with H1/3 of 15 m approaching the upper limit in samples of tabulated data of North Atlantic waves. (Principles of Naval Architecture Chapter 8 [vol. III, section 2]. At such a height, weather ships in the North Atlantic (PNA VIII, Section 2, Fig 20 Roll) recorded wavelengths of around 300 m (a height/length ratio of 1:20). These observations were from regions experiencing very severe weather compared to even the North Atlantic. In a more generalized study, Hogben and Lumb compiled over one million observations spanning 10 years, where wave heights in the highest range (11 to 12 m) accounted for only 0.0013% of worldwide observations (or 0.007% of observations in the Northern North Atlantic).
Observed vs. measured wave heights. Observed wave heights Hv as recorded by trained weather ship observers were found to differ from measured data. Simultaneous data (where waves were both observed and measured) was analyzed by Nordenstrom, who developed the following correlation: H1/3 = 1.68 * Hv0.75
Highest wave. The Guinness Book of World Records claims the highest officially recorded wave of 34 m was measured by Frederic Margraff, USN from the USS Ramapo on its way from Manila (Philippines) to California (USA). The wave was observed on the night of February 6–7, 1933, during a 68 knot (126 km/h) hurricane. If the Nordenstrom correlation were applied to this observed world-record wave (34 m), then a more realistic 23 m is obtained.
The highest instrumentally recorded wave was one of 26 m, recorded by the British Ship Weather Reporter, in the North Atlantic in December 1972 at Lat 59N, Long 19W (directly below Iceland and slightly further north than the top of Scotland).
For a wave with H1/3 of 14 m to develop in the open sea, a sustained wind speed of 63 knots (117 km/h) is required (measured at 19.5 m above the water surface).1 It was also found that observed recordings slightly overestimated the actual measured wave heights in the upper ranges by around 13%. According to the Guinness Book of World Records, the highest wave ever officially recorded was observed at 34 m during a hurricane, but the record for an instrumentally measured wave is “only” 26 m.
Woodmorappe mentions the damping effect of flood debris as a factor in limiting wave development. Floating in the middle of a large mat of vegetation, the ark would be effectively shielded from wind-generated waves. Of course, one could always assume such a floating island of organic material would become waterlogged and sink to the bottom prior to burial by sediment from continental runoff in the late flood stages, which is not a bad explanation for the formation of oil reserves in the Middle East.
Data for waves up to 12 m are listed with their most probable modal wave period in Principles of Naval Architecture V3 Ch8 S2.10 Fig 26. Curve fitting to this data appears to be a second-order polynomial (parabolic) function as follows:
Wave Height = 0.0663*period2 - 0.5168*period + 2.5765 (which fits the data reasonably well; R2 = 0.9993.)
Then by extrapolation, we get the periods for the 30 m wave = 25 secs, 47 m wave = 30 secs. (Obviously a rather dubious extrapolation given that we just extrapolated to 300% of the actual data.)
Assuming a sinusoidal waveform, equation 16 Section 2.2 gives Lw = g * Tw2 / (2 * P), which yields wavelengths of 944 m for the 30 m and 1424 m for the 47 m high wave (length-to-height ratios of approx. 30:1). Such long wavelengths were probably not employed in the Hong study since the ark would ride comfortably over a 50 m swell with a 1.5 km wavelength.
| Sea State | Beaufort Scale | Wind (m/s, knots) | Sea | Height (m) | Length (m) | |
|---|---|---|---|---|---|---|
| 0 | 0 No wind | < 0.2 | < 0.4 | Smooth sea | 0 | - |
| 0 | 1 Gentle air | 1.5 | 3 | Calm sea | 0.5 | 10 |
| 1 | 2 Light breeze | 3.3 | 6.5 | Rippling sea | ||
| 1 | 3 Gentle breeze | 5.4 | 10.5 | Gentle sea | 0.75 | 12 |
| 2/3 | 4 Moderate breeze | 7.9 | 15 | Light sea | 1.25 | 22 |
| 4 | 5 Fresh breeze | 10.7 | 21 | Moderate sea | 2.0 | 37 |
| 5/6 | 6 Strong breeze | 13.8 | 27 | Rough sea | 3.5 | 60 |
| 6/7 | 7 Moderate gale | 17.1 | 33 | Very rough sea | 6.0 | 105 |
| 7 | 8 Fresh gale | 20.7 | 40 | High sea | > 6.0 | >105 |
| 8 | 9 Strong gale | 24.4 | 47 | High sea | ||
| 9 | 10 Whole gale | 28.3 | 55 | Very high sea | ||
| 9 | 11 Storm | 32.7 | 64 | Extremely heavy sea | 20 | 600 |
| 12 Hurricane | >32.7 | >64 | Extremely heavy sea | |||
| Hong paper 1994 | 40.1 | 78 | Structural limit | 30 | 1160 |
| Hong paper 1994 | 50.5 | 98 | Stability limit | 47.5 | 2560 |
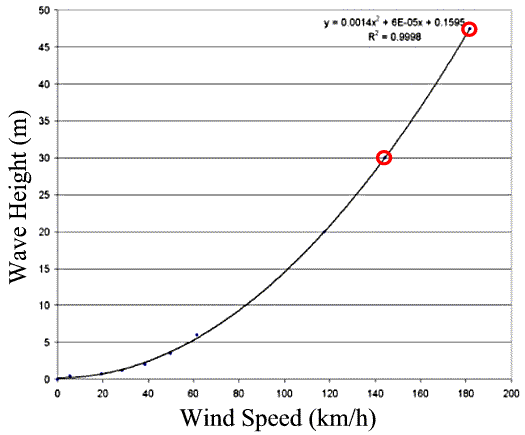
Figure 2. Extrapolated data for the 30 and 47.5 m waves as described in the Hong study. Wave height is related to second power of wind speed, the Henschke data yielding longer wavelengths than the PNA data extrapolation—obviously influenced by the 20 m x 600 hurricane.
Rogue Waves
There is plenty of wave data based on averages, but values such as significant wave height do not indicate the highest wave likely to be encountered. The fact that different sets of waves can be superimposed gives rise to the possibility of a freak wave appearing. These rogue waves are unusually high and unusually steep, often breaking on top of a vessel.
Rogue waves are principally wind generated, possibly a statistical freak between multiple wave sets or a perfect shape to catch the wind. There is also a theory of interplay between wind and currents, which obviously doesn’t explain how rogue waves can form in the absence of significant water current. There is considerable research underway on rogue waves, and some argue for a tightening of shipping rules—especially the increase of wave-bending moments (see appendix below) and wave-slamming loads. Very large ships normally ride several waves at once, but freak conditions such as the Derbyshire incident attest to the danger of the wavelengths equal to the length of the hull.
Tsunamis
A tsunami is a series of ocean waves generated by any rapid large-scale disturbance of the seawater. Most tsunamis are generated by earthquakes, but they may also be caused by volcanic eruptions, landslides, undersea slumps, or meteor impacts. —NOAA
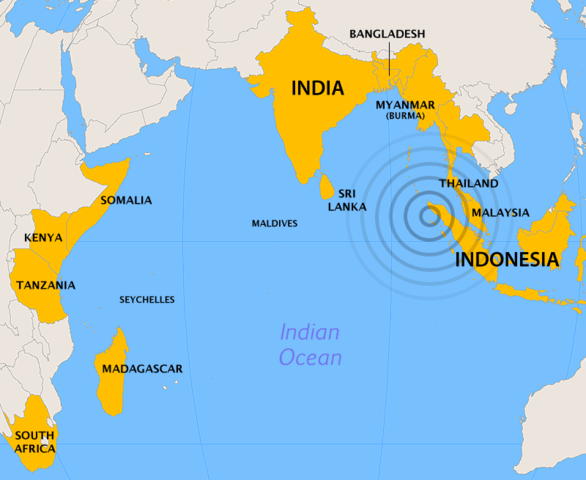
The 2004 Indian Ocean Earthquake magnitude 9.0 struck in deep sea off the western coast of northern Sumatra, Indonesia at 8:00 AM on December 26, 2004. The quake triggered massive tsunamis up to 15 m (50 ft.), devastating coastlines as far as East Africa. Ævar Arnfjörð Bjarmason, CC BY-SA 3.0, via Wikimedia Commons
In deep water, a tsunami has a gentle slope and is only a few feet high, passing under ships virtually undetected. In this case, the wave was 50 cm after several hours.4 The more dangerous wave heights only apply as the wave approaches the shore. In some instances, ships are recommended to head out to deeper water if there is enough time before a tsunami arrives.
In deep water, a tsunami develops such a long wavelength that it is very low and virtually harmless (even unnoticed) to shipping. Wavelength is related to apparent speed (celerity), so the wave formation can attain speeds of up to 500 miles per hour, crossing the Pacific in a day. It is only as it approaches the shoreline that the tsunami begins to compress and rise higher. Its momentum is known to send the water far inland. Since the height of tsunamis in deep water is not dramatic, the run-up data is often quoted. This can be very misleading since the tsunami height can be amplified 20 times as the shallow water slows it down. Cynical imagery of the ark tossed around in 500 m tsunamis (in deep water) would imply there was the potential for 10 km (six miles) of vertical run-up when it hit the shoreline—which is not likely. Such a wave would break in the comparatively “shallow” 1,000–4,000 m water, dissipating its energy and settling down to a more realistic size. In fact, the 520 m tsunami height of the 1958 landslide quoted by ark skeptics took place within a narrow Alaskan bay where there was no time for the wave to develop a standard profile. This is not a deep-sea tsunami wave height.
So a tsunami generated by earthquake, landslide, or volcanic activity could only pose a threat to Noah’s ark in shallow water. With an average depth of nearly three kilometers (two miles), which is well over the NOAA recommendation, the worldwide flood would actually protect the ark from tsunami shoreline effects. In the middle of an ocean where geological activity is concentrated on the perimeter (e.g., such as in the modern Pacific Ocean), the ark would safely ride over tsunami waves.
Rogue Wave vs. Tsunami?
A tsunami is caused by a sudden displacement of water. The most frequent cause is an underwater earthquake, but less frequently, tsunamis can be generated by volcanic eruptions, landslides, or even oceanic meteor impact. The length of these waves, from one crest to the next, can be up to 200 km long, and they travel in the deep ocean at speeds around 700 km/hr. Their height in the open ocean is very small, a couple of meters at most, so they pass under ships and boats undetected.
So-called “rogue waves” are a bit more mysterious and not very well understood. They are very high waves, tens of meters, perhaps. They are very short compared to tsunamis—less than a 2,000 m. They arise unexpectedly in the open ocean, and the generating mechanism is a source of controversy and active research. There are some theories on why these arise:
- Strong currents interact with existing swell to make them much higher.
- They are just a statistical aberration that occurs when a bunch of waves just happen to be in the right spot at the right time so that they add together to make one big wave.
- If a storm “prepares” the ocean by making it very rough and this is followed by a sudden intensification of the storm, then the wind can get a “better grip” on the ocean surface (i.e., wind energy is much more efficiently transferred to the water), and the monster waves can thus be created.
Dr. Frank Gonzalez, https://nctr.pmel.noaa.gov/faq.php
Waves of the Flood
Wind: After the rainfall had ceased and the fountains of the deep subsided, God sent a wind (Genesis 8:1). The ark was still afloat at this stage, so the intensity and geographical scale of these winds hold the key to wave sizes. Record-breaking waves (such as the Hong roll limit of 47.5 m) would be unacceptable at the time of the ark coming to rest on the mountains. In fact, waves of more than a few meters could pose a threat to a beached ark.
In the open sea, a stability limit of 47.5 m or a structural limit of 30 m does not tell the full story since the wavelength must also be specified.
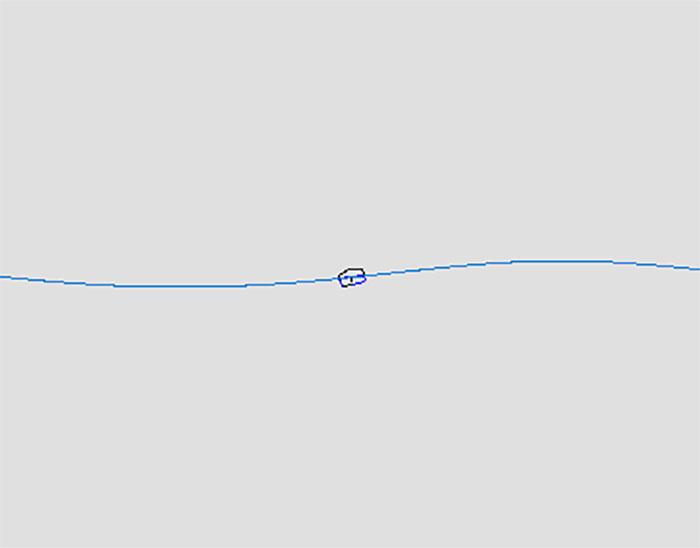
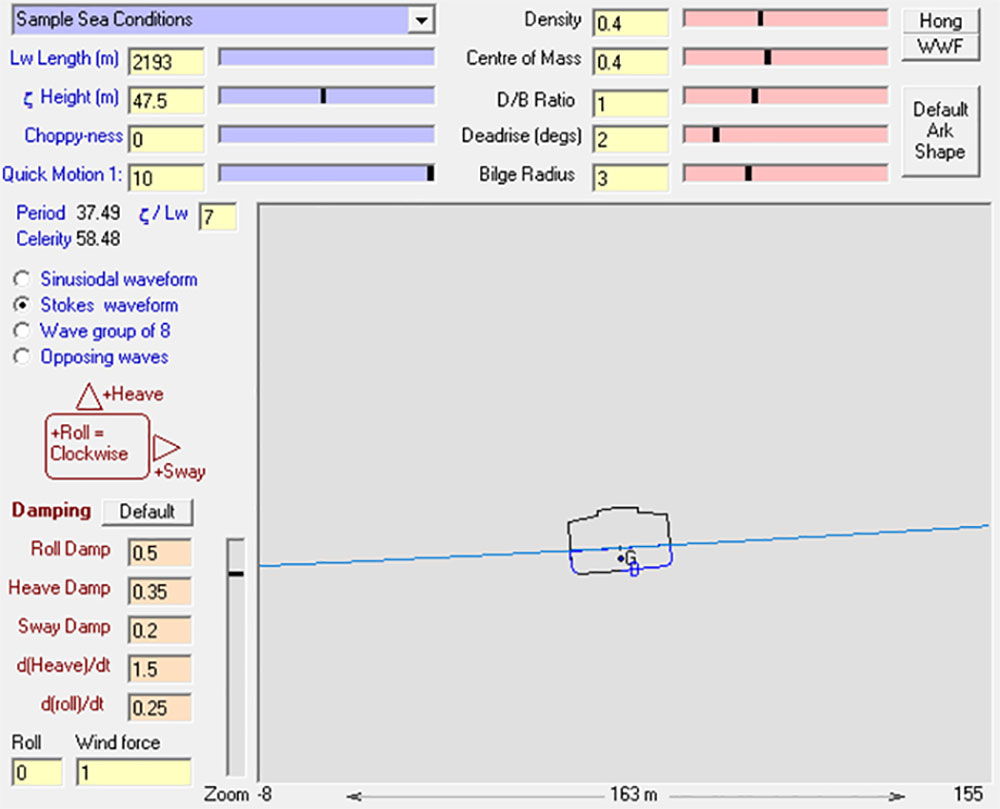
The following screenshot shows the ark in a beam sea. The waves have the more realistic second-order Stokes profile and a very steep ratio of 1:10. For smaller waves, a limit of around 1:7 is generally as bad as it gets before the wave will break on itself. This software was begun by Tim Lovett in an effort to reproduce the roll stability calculations in the Hong paper.5
In closer detail, the ark is rolling in a double period with the Stokes waveform with the roof beginning to dip into the water. Note the center of buoyancy (B), which has not yet corrected the heel angle due to the angular momentum of the vessel generated by the passing wave crest. The wave is “traveling” from left to right in this simulation, the vessel still rolling as it descends. If waves happen to coincide with the natural roll period of the ship, then the roll is amplified. Immediate action is required, such as turning the vessel to change the frequency at which the waves meet the ship.
A more probable ratio of wave height to wavelength is around 1:30, which would look more like this:
Tsunami (based on the catastrophic plate tectonics model): Once the ark had landed, the receding water level would minimize the risk of tsunami damage, especially since the ark was in a mountain range (mountains of Ararat, with other peaks visible). Henceforth, the latter stages of the flood that involve high current velocities during continental runoff are irrelevant.
During the voyage, a tsunami could only pose a threat if the source was nearby, such as a local exploding volcano. Furthermore, the proximity to volcanic activity and its likely nature (explosive or continuous) hold the key to understanding the tsunami waves of Noah’s flood. Essentially, the deeper the water and the more distant the tsunami source, the safer the wave would be when it would’ve reached the ark.
Developing Seas
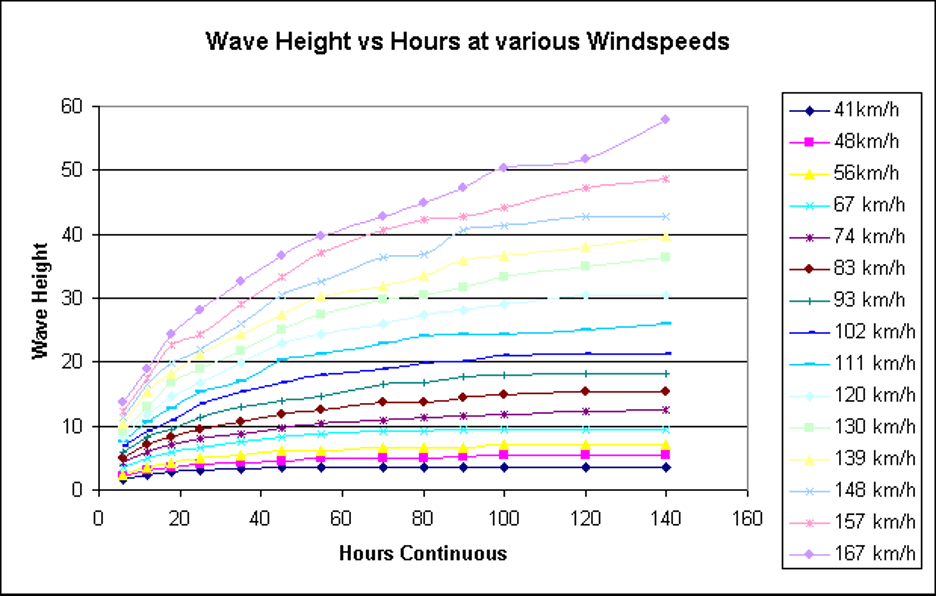
Wave Height vs. Wind Speed and Duration
It is common knowledge that wind generates waves. Stronger wind gives bigger waves.6 Initially, the waves are close together and unsorted, but with a steady wind over a long distance (fetch), the waves become well-formed and further apart. A fully developed sea is one that has reached the full height and wavelength corresponding to a particular wind speed.
The following table shows the relationship between wind speed and duration (fetch) and the effect on wave height and period. The blue figures indicate typical values in a modern sea—very high wind speeds have a fixed direction for only a relatively short time. This table is a metric conversion based on stormsurf.com/page2/papers/seatable.html.7
| Wind km/h | Wind Duration (Hours) | Property | ||||||||||||
|---|---|---|---|---|---|---|---|---|---|---|---|---|---|---|
| 6 | 12 | 18 | 25 | 35 | 45 | 55 | 70 | 80 | 90 | 100 | 120 | 140 | ||
| 41 | 1.74 | 2.38 | 2.74 | 3.05 | 3.35 | 3.66 | 3.66 | 3.66 | 3.66 | 3.66 | 3.66 | 3.66 | 3.66 | height (m) |
| 6 | 7 | 8 | 9 | 10 | 11 | 11.5 | 12 | 12.5 | 12.5 | 13 | 13 | 13 | period (s) | |
| 80 | 185 | 296 | 463 | 741 | 1019 | 1296 | 1852 | 2222 | 2593 | 2871 | 3611 | 4352 | fetch (km) | |
| 48 | 2.13 | 3.05 | 3.66 | 3.96 | 4.27 | 4.57 | 4.88 | 4.88 | 4.88 | 5.18 | 5.33 | 5.33 | 5.33 | height (m) |
| 6.6 | 8 | 9 | 10 | 11 | 12 | 13 | 13.5 | 14 | 14.5 | 15 | 15 | 15.5 | period (s) | |
| 89 | 204 | 315 | 519 | 759 | 1111 | 1482 | 2037 | 2500 | 2871 | 3426 | 4167 | 4815 | fetch (km) | |
| 56 | 2.29 | 3.66 | 4.27 | 4.88 | 5.49 | 6.1 | 6.1 | 6.71 | 6.71 | 6.71 | 7.01 | 7.01 | 7.01 | height (m) |
| 7.2 | 9 | 10 | 11 | 12 | 13 | 14 | 15 | 16 | 16 | 16.5 | 17 | 17.5 | period (s) | |
| 94 | 232 | 389 | 556 | 926 | 1296 | 1667 | 2222 | 2778 | 3241 | 3704 | 4630 | 5556 | fetch (km) | |
| 67 | 3.54 | 4.88 | 5.79 | 6.71 | 7.62 | 8.38 | 8.84 | 9.14 | 9.14 | 9.45 | 9.45 | 9.45 | 9.45 | height (m) |
| 8 | 10 | 11.5 | 13 | 14 | 15 | 16 | 17.2 | 18 | 18.5 | 19 | 19.5 | 20 | period (s) | |
| 111 | 259 | 435 | 667 | 1000 | 1482 | 1852 | 2593 | 3148 | 3704 | 4260 | 5371 | 6297 | fetch (km) | |
| 74 | 4.27 | 5.79 | 7.01 | 7.92 | 8.84 | 9.75 | 10.36 | 10.97 | 11.28 | 11.58 | 11.89 | 12.19 | 12.5 | height (m) |
| 8.8 | 11 | 12.5 | 14 | 15 | 16.2 | 17 | 19 | 19.5 | 20 | 21 | 21 | 22 | period (s) | |
| 119 | 278 | 482 | 741 | 1093 | 1630 | 2222 | 2778 | 3334 | 4074 | 4630 | 5741 | 7038 | fetch (km) | |
| 83 | 4.88 | 7.01 | 8.23 | 9.45 | 10.67 | 11.89 | 12.5 | 13.72 | 13.72 | 14.33 | 14.94 | 15.24 | 15.24 | height (m) |
| 9.3 | 12 | 13.5 | 15 | 16 | 18 | 18.5 | 20 | 21 | 22 | 22.5 | 23 | 24 | period (s) | |
| 130 | 315 | 528 | 787 | 1167 | 1759 | 2315 | 2963 | 3704 | 4260 | 5000 | 6667 | 7593 | fetch (km) | |
| 93 | 5.79 | 8.23 | 9.45 | 11.3 | 13.11 | 14.02 | 14.63 | 16.46 | 16.76 | 17.68 | 17.98 | 18.29 | 18.29 | height (m) |
| 10 | 12.5 | 14.5 | 16 | 17.5 | 19 | 21 | 22 | 23 | 23 | 24 | 25.5 | 26.5 | period (s) | |
| 139 | 333 | 556 | 833 | 1296 | 1945 | 2500 | 3241 | 3889 | 4630 | 5371 | 7038 | 7871 | fetch (km) | |
| 102 | 6.86 | 9.14 | 10.97 | 13.4 | 15.24 | 16.76 | 17.98 | 18.9 | 19.81 | 20.12 | 21.03 | 21.34 | 21.34 | height (m) |
| 11 | 13 | 15 | 17 | 19 | 21 | 22 | 23 | 24 | 25 | 26 | 27 | 28 | period (s) | |
| 148 | 352 | 593 | 926 | 1408 | 2130 | 2685 | 3519 | 4260 | 4815 | 5741 | 7223 | 8519 | fetch (km) | |
| 111 | 7.62 | 10.67 | 12.8 | 15.2 | 17.07 | 20.42 | 21.34 | 22.86 | 24.08 | 24.38 | 24.38 | 24.99 | 25.91 | height (m) |
| 11.5 | 14 | 16.5 | 18 | 20 | 22 | 23.5 | 25 | 26 | 28 | 28 | 30 | 30 | period (s) | |
| 154 | 370 | 648 | 945 | 1482 | 2222 | 2778 | 3704 | 4537 | 5186 | 6019 | 7408 | 9260 | fetch (km) | |
| 120 | 8.38 | 11.89 | 14.63 | 16.8 | 19.81 | 22.86 | 24.38 | 25.91 | 27.43 | 28.04 | 28.96 | 30.48 | 30.48 | height (m) |
| 12 | 15 | 17 | 19 | 21 | 22 | 25 | 26.5 | 28 | 28.5 | 30 | 31 | 33 | period (s) | |
| 163 | 407 | 704 | 1037 | 1574 | 2315 | 2963 | 3889 | 4630 | 5463 | 6297 | 7778 | 9445 | fetch (km) | |
| 130 | 9.14 | 13.11 | 16.76 | 18.9 | 21.64 | 24.99 | 27.43 | 29.87 | 30.48 | 31.7 | 33.22 | 35.05 | 36.27 | height (m) |
| 13 | 16 | 18 | 20 | 22 | 25 | 26 | 29 | 29.5 | 30.5 | 31 | 32.5 | 35 | period (s) | |
| 169 | 435 | 732 | 1111 | 1630 | 2454 | 2963 | 4167 | 4815 | 5649 | 6667 | 8334 | 10371 | fetch (km) | |
| 139 | 10.36 | 15.24 | 18.29 | 21.3 | 24.38 | 27.43 | 30.18 | 32 | 33.53 | 35.97 | 36.58 | 38.1 | 39.62 | height (m) |
| 14 | 17 | 19 | 21 | 23 | 25.5 | 27 | 29 | 31 | 32 | 33 | 34 | 36 | period (s) | |
| 178 | 454 | 750 | 1148 | 1667 | 2593 | 3148 | 4260 | 5000 | 5834 | 7038 | 8890 | 11112 | fetch (km) | |
| 148 | 11.28 | 16.46 | 19.81 | 22 | 25.91 | 30.48 | 32.61 | 36.27 | 36.88 | 40.54 | 41.45 | 42.67 | 42.67 | height (m) |
| 14.5 | 17.5 | 20 | 22 | 23.5 | 26.5 | 28 | 30 | 32 | 33 | 34 | 35 | 36.5 | period (s) | |
| 185 | 472 | 787 | 1185 | 1806 | 2685 | 3334 | 4445 | 5278 | 6112 | 7223 | 9167 | 11297 | fetch (km) | |
| 157 | 12.19 | 17.37 | 22.56 | 24.4 | 28.96 | 33.22 | 37.19 | 40.54 | 42.37 | 42.67 | 44.2 | 47.24 | 48.77 | height (m) |
| 15 | 18 | 21 | 22 | 25 | 27.5 | 30 | 32 | 33.5 | 35 | 35.5 | 37.5 | 39.5 | period (s) | |
| 191 | 482 | 824 | 1259 | 1852 | 2778 | 3519 | 4630 | 5556 | 6482 | 7501 | 9353 | 12038 | fetch (km) | |
| 167 | 13.72 | 19 | 24.38 | 28 | 32.61 | 36.58 | 39.62 | 42.67 | 44.81 | 47.24 | 50.29 | 51.82 | 57.91 | height (m) |
| 16 | 19 | 22 | 24 | 26.5 | 29 | 31.5 | 33 | 34.5 | 36.5 | 37 | 40 | 44 | period (s) | |
| 204 | 500 | 852 | 1296 | 2037 | 2871 | 3704 | 4815 | 5741 | 6945 | 7871 | 9630 | 12594 | fetch (km) | |
Converting to wavelength: For harmonic waves in deep water, as shown previously, the wave period (Tw in seconds) is related to wavelength Lw.
Lw = g * Tw2/2 π8
So, after 120 hours, a steady 157 km/h wind generates waves approaching the 47.5 m mark with a period of 37.5 seconds, giving a wavelength of Lw = 9.8 * 37.52/(2*pi) = 2193 m (2.2 km). This requires a fetch of over 9,000 km, over which the wind has been blowing steadily.
If you were to run those numbers on the Roll Simulator, you will get a rather tame motion, especially at 1x speed. Even in a beam sea, the roll is only six degrees, so the main sensation would be a gentle vertical acceleration—something like being in an elevator. (Stokes waveform gives max acceleration on wave crest of -0.7 m/s2, or 0.07 g.) Compare this to the passenger ship acceleration limit of 0.34 g (at forward perpendicular), which is nearly five times higher. Modern passenger ships are, of course, designed to be very comfortable (low accelerations), so this big (and very long) wave is not presenting a problem.
All of this assumes an ideal well-developed sea without interference from other waves. A more realistic situation would be a dominant well-developed waveform with smaller superimposed waves causing some randomness. In other words, somewhere between ideal wind-driven waves and a totally random sea, but with the globality of the wind (Genesis 8:1) causing a bias toward a regular and fully developed sea.
There is more to the story, however. The vessel will experience wind loads that will cause the vessel to heel (roll). A lightly loaded ark will be worse here because of the larger area for the wind to push against. Collins calculated that a wind of 210 knots (388 km/h) would be required to hypothetically capsize the ark in flat water, so the 157 km/h wind (16% of the energy of 388 km/h) looks feasible even when side-on (broaching).
Of course, the balance to all this is that Noah’s ark should not be side-on to the wind for very long anyway. The ship should align itself with the wind and experience a relatively consistent head sea.
Conclusion
Wind-generated waves under global wind conditions could reach abnormal wave heights but are likely to be very regular and fully developed with long wavelengths. Noah’s ark (or any other decent ship) could comfortably ride huge waves in a fully developed sea because the waves were not steep.9 If the global wind was not so uniform, interference of wave sets could produce a more random sea, increasing the likelihood of steep waves and rogue formation.
The biggest threat to the ark would be a localized storm, which is not likely to form when there is a global wind blowing.10
Appendix: Standard estimate of loads applied by waves
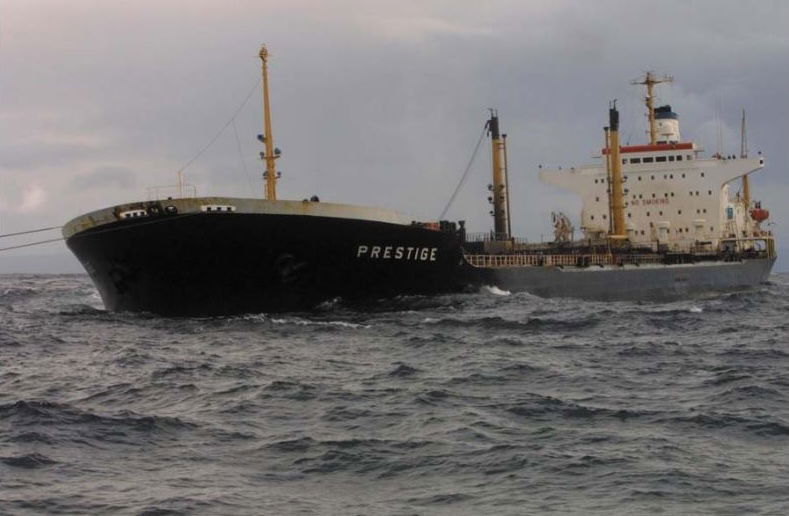
Bahamas Maritime Authority, CC BY-SA 4.0, via Wikimedia Commons
Wave Damage, November 19, 2002
The leaking oil tanker Prestige sank some 240 km off Spain’s northwestern coast, taking more than 77,000 tons of fuel to the seabed four kilometers below.
The Prestige ran into trouble during a violent storm, the salvage company tried to prevent the tanker from splitting by turning it so that its ruptured hull no longer faced the waves, but it broke it half.11
Long Hull Syndrome
The proportions of Noah’s ark are explicitly stated in Genesis 6:15—300 x 50 x 30 cubits. The vessel is 10 times as long as it is high, which means that the bending loads applied by waves will be significant. The ark has similar proportions to a modern ship, and ships are not supposed to break in half. To avoid making a ship that is too weak in the middle, there are rules.
Wave bending moment (Mw) is about waves trying to bend the hull. If the hull can be built to withstand this amount of bending, then it should be strong enough in the worst modern sea. What about the waves of the flood?
The Calculator. Select a cubit and a general shape. The numbers in red indicate how strong the hull needs to be in the middle. Of course, that still leaves all the engineering associated with hull construction yet to be done.
Note:
- Block Coeff is a measure of how closely the hull approximates a rectangular block.
- The American Bureau of Shipping (ABS) has the highest Mw values, which means they are the most conservative.
- If Noah’s ark was built to handle the ABS bending loads, then it should be strong enough for most sea conditions.
- Shear force is related to the tendency for planks to slide against each other.
Calculation of Wave Bending Moment
How strong did the ark have to be?
To endure several months in the open sea, the wooden hull of Noah’s ark must have a certain minimum strength. Factors such as uneven cargo distribution, increased length, or a more “block-shaped” hull (block coefficient) accentuate the need for a strong hull. Another factor is the severity of the sea state.
For a first approximation, we will consider the worst seas of today. In ship design, one of the first things to check is the bending strength of the hull. A ship riding over large waves experiences bending forces (causing a moment or torque) that flex the hull up and down along its length (hogging and sagging). Without adequate strength and rigidity, the ark could leak or break when it meets high seas. The following calculations are based on standard procedures for ships operating in the open sea.
Preamble
Applicability: The following calculations apply to ships longer than 90 m. Cargo ships with homogenous loading or less than 250 m long only require a still water bending moment to be calculated amidships.
Wood in place of steel: The applied wave loads are related to hull geometry and are independent of hull material. The data will be suitable for the timber ark up to the point where material properties such as stress and stiffness are investigated. In other words, the wave bending moment is externally applied so is independent of hull material (assuming adequate stiffness as dictated by waterproofing requirements).
These approximations are based on the vessel’s length, width, and shape, using a worst-case sea state. Several standards are compared, with the most conservative estimate recommended (ABS Rules).
Estimation of Longitudinal Wave Bending Moment
Bending moment is the amount of “bending” the hull experiences. It is highest in the middle (amidships) and occurs when the hull is bridging two waves (sagging or positive bending). Another situation is when a wave is supporting the hull amidships as if the ship were riding a wave (hogging or negative bending). Both need investigation since either case might be the failure mode at sea, and they represent the maximum amplitudes of fatigue loading.
Firstly, we must define the hull size by choosing the most suitable cubit.
Next, the hull shape: The hull of a ship has certain coefficients of form. One of the most fundamental is the block coefficient, Cb, which describes how well the hull approximates a rectangular prism. It is calculated by comparing the design displaced volume with the enclosed volume of its maximum wetted dimensions.
Cb = (Displaced Volume) / ( L * B * T )
Where L is length, B is beam or breadth, and T is the draft. The density of seawater (1.025) may need to be accounted for in determining the draft.
The sculptured hulls of a small ship such as a harbor ferry might have a Cb of only 0.4, whereas the rectangular cross section of large crude oil carriers can have a Cb of almost 0.9. Ark depictions shown as almost a pure rectangular prism could have a Cb as high as 0.98.
Using the popular choice of 18” for the cubit,12 the ABS wave bending moment rules to calculate the hogging and sagging moments, with a block coefficient of 0.9, gives the following values: Hogging (tf-m): 65071.4912, Sagging (tf-m): -67008.743. Use the calculator above to test the effect of hull changes.
Wave BM Calculated According to Shipping Rules
Definition of symbols;
L = length (m)
B = beam or breadth (m)
Cb = Block Coefficient as defined above.
Method 1: ABS Rules
Steel Vessel Rules 2004, Part 3, Hull Construction and Equipment
https://ww2.eagle.org/en/rules-and-resources/rules-and-guides.html
Bending Moment
ABS Rules for Building and Classing Steel Vessels 2004. Part 3, Chapter 2, Section 1, Subsection 3.5.1 “Wave Bending Moment Amidships”
(Note that the ABS rules make a distinction between maximum hogging and sagging conditions. Also note that the ABS rules are the most conservative of these classification societies.)
Mw = -k1 * C1 * L2 * B * (Cb + 0.7) / 1000 (sagging)
Mw = k2 * C1 * L2 * B * Cb / 1000 (hogging)
Where:
C1 = 10.75 - (300-L) / 100) 3/2 (for 90<= Length <= 300m)
Sagging k1 = 11.22 (for units in tf.m)
Hogging k2 = 19.37 (for units in tf.m)
Method 2: Lloyd’s Register
Rules for Steel Ships
Bending Moment
Lloyd’s Chapter D, part 315 gives a formula for estimating the bending moment midway along the hull (amidships) that could be applied by typical sea waves. The factor C1 is tabulated and based on shipping data.
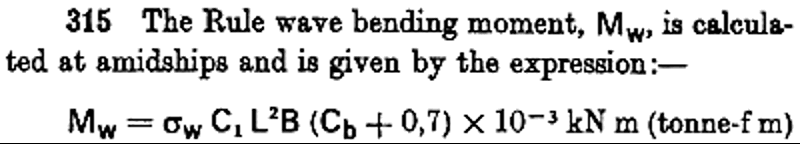
Linear interpolation of tabulated values near the ark length gives C1 = 6.2527 + 0.0178*L
Lloyd’s specifies a material stress of 98.1 MPa (assumes a steel hull). All other variables are as previously defined.
Method 3: Bureau Veritas
Rules and Regulations for the Construction and Classification of Steel Vessels. 1977. International Register for the classification of ships and aircraft. (Henri-Rochefort 75821 PARIS CEDEX 17)
Bending Moment
BV 5-23-31 The maximum rule value of wave bending moment in kN.m is given by the formula:
MH = H L2 B ( Cb + 0.7 ) 10-3
Where
H = 703 - 65 ( (300 - L) / 100)3/2 if L < 300
Wave Shear Force (ABS)
American Bureau of Shipping. 2014. ABS Rules for Building and Classing Steel Vessels 2004. Part 3, Chapter 2, Section 1, Subsection 3.5.3 “Wave Shear Force.”
The maximum shearing force induced by wave, in kN (tf, Ltf)
Fwp = + k1 * F1 * C1 * L * B * (Cb + 0.7) / 100 (pos shear)
Fwn = - k1 * F2 * C1 * L * B * (Cb + 0.7) / 100 (neg shear)
Where:
k1 = 30 (3.059, 0.2797) kN (tf,Ltf)
F1 = distribution factor, as shown in 3-2-1/Figure 3
F2 = distribution factor, as shown in 3-2-1/Figure 4
This factor is 0.7 amidships rising to 1.0 at approx. 25% from bow/stern. We assume the highest value 1.0.
C1 = C1 = 10.75 - ((300-L) / 100) ^ 3/2 (for 90<= Length <= 300 m) The same as the bending moment.
L = length of vessel in m (ft.)
B = breadth of vessel in m (ft.)
Cb = block coefficient, but not to be taken less than 0.6
Comments
The calculations follow the same general form, where the wave bending moment is proportional to L3.5 and also to B1. For ships up to 300 m long, the intensity of bending in the hull is very sensitive to the ship’s length (L). So, a long, wider hull is more likely to break in half (or leak badly) due to the wave-induced bending moment.
Supporting these relatively simple calculations is an extensive record of monitoring ship stresses during service. These formulae have been determined on the basis of sea states throughout the world and take account of storms and worst-case uncertainties (just the wrong combination of wave height, length, etc.). While direct stress analysis using the finite element methods is possible today (barely!), these simple formulae are the trusted solution. Highly detailed analysis is required if the designer intends to use a number lower than these.
Answers in Depth
2024 Volume 19

Answers in Depth explores the biblical worldview in addressing modern scientific research, history, current events, popular media, theology, and much more.
Browse Volume
Editor’s note: This article is based on content that was originally published at WorldwideFlood.com.
Footnotes
- PNA VII, S2, Tables 6 & 7
- Schneekluth, H., and V. Bertram. 1998. Ship Design for Efficiency and Economy. 2nd ed. Oxford: Butterworth-Heinemann.
- Marchaj, Czesław. 1986. Seaworthiness: The Forgotten Factor. London: Adlard Coles 1986.
- The first-ever direct measurement of deep-sea tsunami waves by radar satellites. The devastating Indian Ocean earthquake produced one of the most destructive tsunamis ever seen, yet NOAA analysts estimated the tsunami wave to be 60 cm after two hours, dropping to 40 cm after nearly nine hours: NOAA. n.d. “Sumatra, Indonesia Earthquake and Tsunami, 26 December 2004.” Accessed July 29, 2024. https://www.ngdc.noaa.gov/hazard/26dec2004.html.
- Ark Analysis Code. Attempting to match the Hong numbers in Table 3, I chose to work through the roll buoyancy calculation from first principles. The physics are extremely simple: a direct force balances the downward weight force (acting through the center of gravity G) and the upward buoyancy force (through the centroid of the submerged area B). These are calculated using a polyhedral hull cross section and a linear waterline approximation, with the instantaneous center of rotation at the center of mass. The integral of the moment arm is then easily calculated by summing incremental increases in roll angle from zero to critical angle (see Hong et al., Table 3).
To make it dynamic, the unrestrained vertical and angular accelerations were found using Newton’s second law: F=ma & T=Ia. That’s about it. No account has been made for wave reflection or other effects in the proximity of the hull, so the accuracy would be reduced with smaller wave sizes (not that we really care about small waves here).
The biggest problem with dynamic simulation is arriving at a figure for the damping factors, since a direct analytic function for something like roll damping is a bit hard to find. Numbers like these are usually arrived at by a combination of scale model testing and computer simulation. - Whitcomb, John C., and Henry M. Morris. 1961. The Genesis Flood. Philipsburg, NJ: P&R Publishing. 267. “The height and spacing of wind generated waves increase with the wind speed and the ‘fetch length;’ that is, the open, unrestricted distance along which the wind can blow across the water surface. With a boundless ocean and a sudden great air movement from the poles to the equator, unimpeded by frictional resistance afforded by land surfaces, the potential wave size during this period would seem to be enormous.” (C. L.Bretschneider. 1957. “Hurricane Design Wave Practices,” Journal of the Waterways ad Harbors Division of the American Society of Civil Engineers 83, no. 2 (May 1957): 3.)
- Stormsurf. n.d. “Sea Height and Period.” Accessed July 29, 2024. http://www.stormsurf.com/page2/papers/seatable.html.
- Lewis, Edward V. 1988. Principles of Naval Architecture: Volume III – Motion of Ships in Waves. Alexandria, VA: Society of Naval Architects and Marine Engineers. 611.
- Woodmorappe, John. 1996. Noah’s Ark: A Feasibility Study. Dallas: Institute for Creation Research. 54. “When the fetch of the wind-driven waves is virtually unlimited (as occurs in the Southern Ocean: Cornish 1934, p. 30), the wind driven waves have great wavelength and great crest-length, but not excessive height.” Cornish, Vaughan. 1934. Ocean Waves and Kindred Geophysical Phenomena. Cambridge: Cambridge University Press.
- Woodmorappe, John. 1996. Noah’s Ark: A Feasibility Study. Dallas: Institute for Creation Research. 54. “Hurricanes require a calm atmosphere to form, and are inhibited or suppressed by wind shear.” Emanuel, K. A. et al. “Hypercanes: A Possible Link in Global Extinction Scenarios.” Journal of Geophysical Research: Atmosphere 100, no. D7 (July 1995): 13, 755, 765.
- Ships are not supposed to break in half. When the Prestige went down it leaked more than 55,000 tons of oil. The ABS report released in February 2003 could not pinpoint the cause of the hull wall failure but was critical of Spain’s refusal to allow the ship to take shelter when it began to list 20 km off the coast. Spanish authorities had the ship towed out to sea to face high winds and heavy seas. It took six days to break in half completely. In the last 25 years, only one ABS-certified ship has gone down—in a typhoon.
- Editor’s note: The Ark Encounter uses the Hebrew long cubit, which is 20.4”. See How Long Is a Cubit?.
Support the creation/gospel message by donating or getting involved!

Answers in Genesis is an apologetics ministry, dedicated to helping Christians defend their faith and proclaim the good news of Jesus Christ.
- Customer Service 800.778.3390
- Available Monday–Friday | 9 AM–5 PM ET
- © 2026 Answers in Genesis