
Age Determination of Coastal Submarine Placer, Val'cumey, Northern Siberia
Originally published in Journal of Creation 14, no 3 (December 2000): 83-90.
Abstract
Unlike historical dating which depends on direct observation of past events, and is reliable, all 'scientific' dating methods depend on assumptions about what happened in the past.
Summary
The age of a coastal submarine tin placer in the Chaun Bay of the East-Siberian Sea near the Val’cumey ore field in north-eastern Siberia has been estimated from a simple accumulation model. The placer began to form after a major mountain-building episode and continental uplift, and has continued to accumulate to the present day. The age accumulation model was applied using field data and also with data obtained from a diffusion-convection model of placer ore generation. The calculated age for the placer was 5,500 years. This contradicts the traditional, uniformitarian age estimate of 40 Ma, but is consistent with the biblical framework. The mountain building episode and placer initiation occurred during the Recessive stage of the Flood some 4,300 years ago, and placer accumulation has continued through the post-Flood era to the present time.
Introduction
There are many different scientific ‘dating’ methods that have been used to estimate the ages of various geological objects. However, unlike historical dating which depends on direct observation of past events, and is reliable, all ‘scientific’ dating methods depend on assumptions about what happened in the past. Without such assumptions no age can be calculated. No matter how reasonable these assumptions may seem, we can never be certain they are true unless we have eyewitnesses for the entire time period in question.
Although radiometric and palaeontological ‘dating’ methods are used to support ages of millions and billions of years, many geological processes have been found to indicate a relatively young age for the earth. These include Na+ accumulation rates in the ocean1, the rate of disintegration of comets2, sedimentation3 and coal generation rates4.
In this paper we present an age determination of a tin placer at Val’cumey Point, north-eastern Siberia. Estimates have been determined using analysed tin concentrations in field samples from different parts of the placer, and also using calculated tin concentrations derived from a mathematical model of placer dynamics.
Geological structure and sediment transport
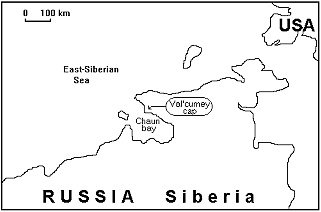
The Val’cumey coastal submarine tin placer is situated in the Chaun Bay of the East-Siberian Sea near the Val’cumey ore field in northern Siberia (Figure 1). The Val’cumey coastal submarine placer of tin is associated with an actively denuding relief. Tin-bearing sediments are eroded from a cliff and the friable slope above the beach.
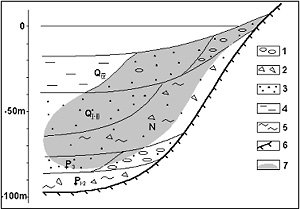
Figure 2. Diagrammatic section through the coastal submarine deposits near Val’cumey point.
| Legend | |
| 1. Pebbles | P1 = Paleocene-Eocene |
| 2. Detritus | P2 = Oligocene |
| 3. Sands | N = Miocene-Pliocene |
| 4. Silt | Q1 = Pleistocene |
| 5. Clay | Q2 = Holocene |
| 6. Shale | |
| 7. Placer deposits | |
Longshore currents transport and disperse the eroded sediments laterally along the shore from the top of Val’cumey Point toward the north. Sediment transport is restricted to the surface layers of the near-shore zone, here termed the active zone. High concentrations of tin are deposited as lenses of cassiterite (SnO2) parallel to the modern shoreline. The highest concentrations and greatest volumes of cassiterite are relatively close to the eroding cassiterite source. Farther to the north concentrations of the cassiterite decrease.
Almost all the coastal submarine placer is confined to the strata that extend some 70 m below the surface (Figure 2). The strata consist of buried slope deposits (clays with angular detritus and poorly rounded pebbles), beach and submarine shelf pebbles, and sand and silt deposits. According to uniformitarian geologists, the age of these strata vary from Palaeocene (~60 Ma) to Holocene (<10,000 years). All the stratigraphic units have been correlated with stratigraphic units of other regions of the Russian Arctic5.
The average diameter of cassiterite grains in the deposit is 0.31 mm, but varies locally depending on the host sediment. Pebble deposits contain the largest cassiterite grains (average 0.54 mm), and silt the smallest (0.13 mm). The average size of cassiterite in host sand is 0.18 mm. The highest concentrations of cassiterite are associated with sand and pebble host deposits.
Comparison of the rock lithology, sediment particle size, and cassiterite concentration in drill cores, shows that sediment transport occurred in the same direction and with similar intensity from the beginning of placer formation to the present day.
The mathematical model
For our purpose we used the diffusional-convectional model of two-dimensional dispersion of tracer in one-dimension unlimited-length stream and transformed it conformably for placer formation.
The subsequent equation describes tin content in the bottom sediments of continental shelf downflow due to lateral coastal drift from the source of tin-bearing material :

| where | C=content of tin in the bottom sediments at the point with co-ordinates (x,y). x=distance from the beginning of the lateral coastal drift, with the x-axis position in the drift direction and parallel to the shoreline. y=distance from the shoreline perpendicular to it in the oceanward direction. xcs=co-ordinate of centre of arrival into the lateral coastal drift tin-bearing material zone. We assume the source of the tin-bearing material is like a point source because its width is much less than the length of the placer. Bi, Ai, βi=coefficients of equation defined by the field data. |
The method of application of this equation and the determination of the equation's coefficients has been well established by the authors. It has also been applied in geological prospecting of the coastal submarine placers of tin and had considerable economic benefits.
Calculation of correlation coefficients and testing of the adequacy of the model was conducted in several tin bearing districts of the north-eastern coast of Russian Arctic, but only one of them have obtained enough data to calculate the placer’s age. It is located a short distance from Val’cumey point in Chaun Bay, East-Siberian Sea.
C is calculated as the sum of different fractions of cassiterite (tin ore). In the case of the Val’cumey ore field the quantity of main fractions are 2: coarse, more than 0.3 mm, and fine (small), less than 0.3 mm—so we use subscripts c and s to denote coarse and fine (small) fractions accordingly. Thus we put into the computation 2 types of coefficients and calculate C as the sum of the 2 fractions (n=2).
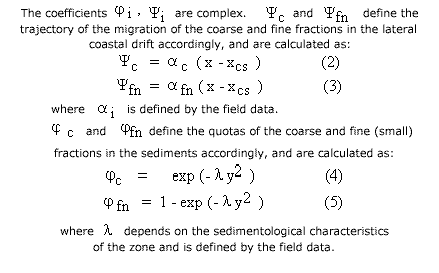
The authors developed their own software for computing the optimum value of the coefficients for best correlation of the modelling and field data. In this best case the correlation coefficient of field and modelling data is 0.87 (the critical value for the 1% level of significance is 0.25) which indicates a genuine correlation between the model and the actual processes.
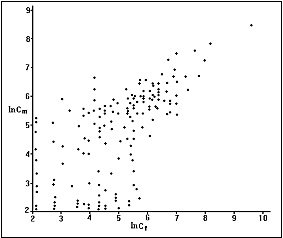
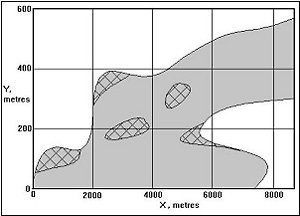
In the Figure 3 (logarithm of field content of tin on the X-axis and logarithm of modelling content of tin on the Y-axis) it can be seen that in the range of high tin contents (that are important for mining industry especially), the correlation is even better. Some dispersion of the correlation in the range of low tin contents is accounted for by being near the local background of tin concentration, where the distribution of tin is random. This can be seen on Figure 4, that shows the tin content of the bottom sediments of Val’cumey placer within the limits of importance to mining (log Cf > 5). Within these limits there are considerable values of difference between field and modelling data (logCf - logCm)2 > 1.0 observed over only 14% of the placer’s square.
Thus we believe that the obtained model is equivalent to the real process of placer formation, and we can therefore use this method both for prediction of tin contents in the bottom sediments on the continental shelf for the needs of the mining industry, and for estimation of placer’s age.
Determination of placer age
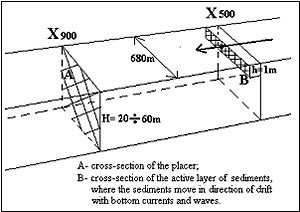
The age of the placer was estimated from a simple accumulation model by assuming that the lateral drift processes operating at present have formed the entire placer in the past (Figure 5). The longshore transport of sediment occurs in the active surface layer only, carrying tin into the placer downstream of Section X. Thus, to calculate the time since tin first began crossing Section X, it is necessary only to estimate:
-
The quantity of tin entering the placer in the active zone at Section X.
-
The total quantity of tin in the placer downdrift of Section X.
Let the total quantity of tin in the placer downstream of Section X be Px (tonnes) and the rate at which tin enters the placer at Section X be Rx (t/year). Thus the generation time (that is, the time elapsed since tin first started entering the placer downdrift of Section X) is given by:
Tx = Px / Rx (years) (6)
The rate at which tin enters the section can be determined by estimating the longshore drift velocity and tin concentration in the active layer at Section X. Let V be the longshore drift velocity (m/year) in the active zone, and Z the thickness (m) of the active zone. Assume these are constant across the whole width, Y, of Section X.
We also assume V and Z are constant over the whole length of the placer. These assumptions were tested by comparing the field data with the model results. The correlation coefficient indicating a good correspondence between the model and the observed field data. It was thus concluded that the assumption of constant velocity and constant thickness for the active zone is reasonable.
Let the tin concentration (t/m3) in the active layer be C(x,y), which will vary across the section and over the length of the placer. The amount of tin in a square prism 1 m wide and 1 m thick that extends across the whole of Section X in the active zone is given by:
∫C(x,y)dy (t/m2)
This is referred to as the line production at Section X. The rate at which tin enters the placer at Section X (t/year) is therefore given by:
Rx = V Z ∫C(x,y)dy (t/year)
Thus the generation time, or the time since tin first entered the placer downdrift of Section X can be calculated from equation (6):
Tx = Px / (V Z ∫C(x,y)dy) (years) (7)
Longshore drift velocity
The longshore drift velocity was estimated at the active placer tongue near the source of tin-bearing material at the cliff. The estimated volume of sediment eroding from the source into the drift zone is about 3,000 m3 per year.6
The width of the active placer tongue at this point is about 100 m and the thickness, Z, of this active layer is not more than 1 m. We estimated this thickness in the field from periodic drilling measurement of sand depth, experiments with marked sands, and geochemical sampling for marked elements. Thus the longshore drift velocity (V) is the arrival rate divided by the cross-sectional area:
3,000 / (1 x 100) = 30 m/year
We can use this velocity as the velocity of cassiterite movement in the lateral coastal drift because cassiterite grain-size correlates strongly with the average grain-size of the host detrital material.
To simplify the calculation we assume the longshore velocity is constant. The shape of the beaches and the cliff suggest that the volume of transported sediments in the transit zone downdrift of X = 0 is approximately constant. Hence, the width increase in the downdrift section (390 m compared with 100 m) is balanced by a decrease in the active zone thickness. Therefore, the sectional area of the active zone, and the transport velocity, is approximately constant. In any case, the assumption does not greatly affect the calculated age.
This correlation was first formulated by Rubey.7 He called it the ‘principle of hydraulic equivalence’, which means that grains with different specific gravity having identical hydraulic equivalence will experience similar movement in the same hydraulic environment. Rittenhouse8 describes a practical method for the determination of the relative sizes of hydraulically equivalent sediment grains. Others subsequently improved this method9-12. Osovetsky13 notes another 11 factors, apart from hydraulic equivalence, which influence the relationship between the sizes of heavy mineral grains and their host sediment grains. Some of these include grain shape, mode of transport, the roughness of substrate, etc. Hydraulic equivalence is only one factor.
Results using field data
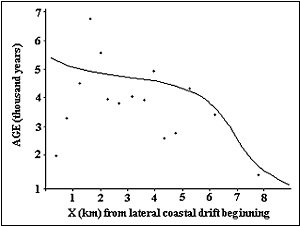
The generation times at a number of cross sections have been calculated from equation (7) using analysed tin concentrations from field samples in the active zone, C(x,y), and the total quantity of tin in the placer downstream of each section.
It can be seen (Figure 6) that there is considerable scatter in the calculated ‘age’ ranging from 1,700 years to 7,900 years. We consider that the scatter is due to statistical variation associated with the sharp, natural variability in the raw field data due to:
-
The inhomogeneous distribution of tin in lenses etc. within the host sediments of the placer.
-
The intermittent and discontinuous method of sampling of the bottom sediments.
-
Analytical errors in determining the tin content of individual samples due to small sample volumes and non-uniform cassiterite distribution in the bottom sediments.
Nevertheless, there is a general trend of decreasing age with increasing distance from the source (Figure 6).
Results using modelled placer concentrations
To overcome the problem of scattering caused by variations in the field data, we have calculated the placer age using a mathematical diffusion-convection model of placer generation14. This model has been calibrated against actual field data from north-east Russia.
The authors’ field experience led to the application of this model and determination of its mathematical coefficients for the Val’cumey deposit. These coefficients define the trajectory of migration of the coarse and fine sediment fractions, the hydrodynamic activity and the influence of the source of cassiterite. The model may be applied in the early stage of prospecting work and refined as subsequent drilling information accumulates. It has been applied in prospecting for coastal submarine tin placers in far north-eastern Russia with considerable economic success.
The correlation coefficient between field data and modelled results shows that the results of the model clearly reflect the structure of the geological object being modelled. We thus conclude that this mathematical model well represents the physical process of placer formation. We also argue that we can apply the results of this model to estimate the age of the placer.
The results are shown in Figure 6 together with the previously calculated ages based on the field data. The placer generation time based on modelled placer tin concentration correlates with the results of the field data.
Discussion
Accordingly to the theory of placer generation, placers form after a phase of intensive tectonic movement that is commonly accompanied by ore lode emplacement and mountain-building. After this, a process of denudation forms a thick sequence of overlying conformable clastic deposits, which contain large amounts of heavy minerals in low concentrations. New placers are generated when the heavy minerals are concentrated by the action of water on these sediments.15,16
The age results display a trend of decreasing generation time with increasing distance from the source. That is, the estimated age is much smaller in the tail of the placer, which is farthest from the source of tin. This is consistent with the extra time required for the tin to drift further along the shore before the placer can start to accumulate in the more distant section. This confirms that the placer is still actively forming and has not reached a long-term equilibrium. The trend of ‘age’ ranges from around 5,500 years at X = 0 to about 1,000 years at X = 8,000 metres. If the placer really were millions of years old then this clear downward trend in ‘age’ would not be discernible.
Interestingly, we created this age model using the uniformitarian assumption, ‘the present is key to the past’. But when we used present-day rates of erosion, velocity of sediment transport, and source concentration of tin, we obtained results that agree with the biblical time-scale for earth history.
It could be objected that the calculated age is not the real age of the placer, but only the interval of time required to form at today’s rate of geological processes. If this is the case, then the placer would have remained under stagnate conditions for 39,9994,500 years (40 Ma less 5,500 years) without any trace of erosion or sedimentation. Thus, there should be evidence of a residual soil—a significant reduction in sediment particle size and an increase in the abundance of organic material. No such evidence is observed in any part of the Val’cumey placer. The sediment characteristics (boulders, gravel, sand and clay) at the base of the placer are very similar to those of the modern deposits at the surface. Thus, the calculated age closely represents the real age of the placer.
Therefore, one can contend with confidence that the time interval for the Val’cumey placer generation (and with all the corresponding sediments of the Arctic region from the Oligocene to the Holocene) was about 5,500 years. This is within range of the biblical time-frame for the global Flood which ended with tectonic movement, continental uplift, falling sea levels and receding Floodwaters about 4,300 years ago—an age based on a literal addition of the chronologies in Genesis. This age is within the limits of accuracy of our calculations—an accuracy we estimate to be 10-20% at best.17
We can easily explain the difference by a higher frequency and intensity of storms in the past, immediately after the Flood.18 In this case, the longshore velocity, V, would not be constant with time, but may be decreasing even exponentially19 from a much higher magnitude to the present-day experience. Our investigation shows that the initial post-Flood rate of denudation (a surrogate for energy of geological processes and hydrodynamic intensity) for north-eastern Russia was 10–32 times higher than now.20 Therefore, the actual age, especially near the placer source, may be much less than the age determined in these calculations.
Thus we infer from the above age calculations and the model of placer generation that the placer at Val’cumey Point was initiated during the Flood about 4,300 years ago near the source of tin. Powerful tectonic movements during the Flood accompanied the beginning of this process and resulted in the formation of the Chaun depression and the high mountains around it. Subsequent activation of land surface erosion as the Flood receded, transported tin-bearing material to the coastal submarine environment, and cassiterite concentration by wave action has led to the development of the deposit. These processes formed the largest part of the placer during a short time. More recent extension of the placer has occurred as the result of the transport of tin-bearing loads by means of lateral coastal drift, separation and concentration of cassiterite during this transport, then sedimentation in the accumulation zone. This process continues today.
Hence, according to the creationist’s classification of sedimentary strata21 we link placer initiation to the Recessive stage of the Flood 4,300 years ago with placer accumulation continuing through the post-Flood era. This period is one of two periods in earth history favourable for placer generation.22
Conclusion
Age calculations of ore bodies based on a diffusion-convection model for ore generation provide a useful method for determining the age of local and regional geological structures. Applied to a tin placer in northern Siberia, the modelling data reflects well the natural process of placer formation and smoothes much of the extreme local variability of the sampled field data.
Detailed investigation has allowed us to estimate and age for sedimentary strata hosting a submarine tin placer, traditionally estimated by evolutionary geologists as 40 Ma. The results show that the placer began to form some 5,500 years ago after major mountain-building tectonism, and continues to form to the present day. The calculated age is consistent with a mountain building episode and placer initiation occurring during the Recessive stage of the Flood, dated from the Bible at approximately 4,300 years ago. Placer accumulation continued through the post-Flood era. The period commencing in the Recessive stage of the Flood and extending to the post-Flood era is one of two periods in earth history favourable for placer generation.
Acknowledgement
The authors express thanks to Guy Berthault for his support for our investigation. We also thank Dr Pierre Jerlström, Dr Andrew Snelling and Dr Tas Walker for editing earlier versions of our manuscript, useful notes for the paper’s content and for improvement of our English.
References
- Austin, S.A. and Humphreys, D.R., The sea’s missing salt: A dilemma for evolutionists, Proceedings of the 2nd International Conference on Creationism, Volume II, Creation Science Fellowship, Pittsburgh, PA, pp. 17–34, 1990.
- Faulkner, D.R., Comets and the Age of the Solar System, CEN Tech. J. 11(3):264–273, 1997.
- Snelling, A.A., Can Flood Geology Explain Thick Chalk Beds? CEN Tech. J. 8(1):11–15, 1994.
- Schönknecht, G. and Scherer, S., Too much coal for a young Earth? CEN Tech. J. 11(3):278–282, 1997.
- Ainemer, A.I., Prokhorova, S.M. and Anikeeva, L.L., Formation and sedimentation processes on continental shelves, Transactions of Scientific Research Institute of Arctic Geology 186:1–190, 1981, (in Russian). Describes examples of the geological processes on the continental selves of the north-east of the former USSR.
- Lalomov, A.V. and Tabolitch, S.E., Catastrophism in geology: Determination of the generation time of coastal submarine placers based on mathematical modelling, CEN Tech. J. 10(3):373–378, 1996, p. 376.
- Rubey, W.W., The size distribution of heavy minerals within a water-laid sandstone, Journal of Sedimentary Petrology 3:3–29, 1933.
- Rittenhouse, G., The transportation and deposition of heavy minerals, Bulletin of the Geological Society of America 54:1725–1740, 1943.
- Van Andel, T.J.H., Provenance, Transport and Deposition of Rhine Sediments, H. Veenman and Sons, Wageningen, Netherlands, p. 129 , 1950.
- White, J.R. and Williams, E.G., The nature of a fluvial process as defined by settling velocities of heavy and light minerals, Journal of Sedimentary Petrology 37:530–539, 1967.
- Hand, B.M., Differentiation of beach and dune sands, using settling velocities of light and heavy minerals, Journal of Sedimentary Petrology 37:514–520, 1967.
- Lowright, R., Williams, E.G. and Dachille, F., An analysis of factors controlling deviations in hydraulic equivalence in some modern sands, Journal of Sedimentary Petrology 42:635–645, 1972.
- Osovertsky, B.M., Heavy Minerals of Sediments, Irkutsk University Publishers, Irkutsky, USSR, 1986, (in Russian).
- Ref. 6.
- Wells, J.H., Placer examination—principles and practice, U.S. Bureau of Land Management Technical Bulletin 4:133, 1969.
- Snilo, N.A., Foundations of Placer Study, Nauka Publishers, Moscow, USSR, 1981 (in Russian).
- Tsopanov, O.H., Manual of Methods for Search, Prospecting and Resource Calculation of Gold and Tin Placers, Sevvostegeologiya Publishers, Magadan, USSR, 1982 (in Russian).
- Nevins, S.E., Post-Flood strata of the John Day Country, northeastern Oregon, Creation Res. Soc. Quart. 10:191–204, 1974.
- Oard, M.J., Review of ‘Sea floor sediments and the age of the Earth’ by Larry Vardiman, CEN Tech. J. 10(3):328–329, 1996.
- Lalomov, A.V. and Tabolitch, S.E., Placer mineral deposit on a young earth, Creation Res. Soc. Quart. 35(4):211–220, 1999.
- Walker, T.B., The Great Artesian Basin, Australia, CEN Tech. J. 10(3):379–390, 1996.
- Lalomov, A.V. and Tabolitch, S.E., Gold placers in earth history, CEN Tech. J. 11(3):330–334, 1997.
Recommended Resources

Answers in Genesis is an apologetics ministry, dedicated to helping Christians defend their faith and proclaim the good news of Jesus Christ.
- Customer Service 800.778.3390
- Available Monday–Friday | 9 AM–5 PM ET
- © 2026 Answers in Genesis


