The views expressed in this paper are those of the writer(s) and are not necessarily those of the ARJ Editor or Answers in Genesis.
Abstract
With postcranial data on morphological characteristics of Homo naledi available, a more precise baraminological analysis and classification is possible for this species. Opinions amongst creationists as well as evolutionists are divided as to whether H. naledi is a new species, basal to the group Homo, or whether it could be an already discovered member of the genus Homo, or even a species of ape, an australopithecine. With the inclusion of 37 postcranial morphological characters, this work attempts to reassess the baraminic classification of H. naledi. It is important that knowledge of morphology balances statistical consideration in order to provide a more holistic classification of species within a holobaramin. According to the results, no significant continuity exists between H. naledi and Homo sapiens and Homo neanderthalensis. However, a moderately positive correlation exists between H. naledi and Australopithecus sediba. Compared to previous baraminic analysis, H. naledi has shifted away from the Homo baramin more towards A. sediba, although final results still remain tentative. Furthermore, characteristics of the hand, upper limb, and feet show that these two species were similarly adapted to arboreal locomotion as well as a form of terrestrial bipedalism. Also, a partial variant of the BDIST software was devised to allow weighting of morphological characters.
Introduction
After the publication of the findings of H. naledi in 2015 (Stringer 2015), a few publications have been made as to its postcranial measurements. One paper has been published about the hand (Kivell et al. 2015) and another on the foot (Harcourt-Smith et al. 2015) of H. naledi in the journal Nature. Many evolutionists claim that H. naledi is an early form of the genus Homo, with transitional characteristics between australopithecines and early humans. Based on an earlier analysis of purely craniodental data (O’Micks 2016), it was deduced that H. naledi, even though a little distant from well-known humans, such as H. sapiens and H. neanderthalensis, was still within the human kind.
According to Wood’s (2016) baraminological reanalysis and update of the Homo holobaramin based on 87 craniomandibular characteristics, H. naledi as well as other species from “early” Homo, such as Homo habilis, Homo erectus, and also A. sediba all fall into the Homo holobaramin. This is based on the view that modern humans should not be the basis for distinguishing humans from non-humans. Basically this means that since humankind encompassed much more variation in the past than what we see today, we should not reference everything with modern human, because this could create bias. In other words, should we compare only ancient variants of Homo to modern variants of the same holobaramin?
Peter Line (2015) explains that certain characteristics of H. naledi which are similar to australopithecines are within the range of variation of H. erectus and H. neanderthalensis. This is a view also espoused by Tim White, paleoanthropology professor at Berkeley, California. For example, the distally wide ribcage has been observed in some Neanderthal specimens (Hartley 2015). The high and lateral scapula on the thorax with little humeral torsion is also characteristic of H. erectus (Line 2015). The wrist and palms resemble those of modern humans, yet the curved fingers also resemble that of a H. erectus specimen, which might be due to vitamin D deficiency. These evidences might suggest that H. naledi might be human, if H. erectus is also truly human. However, we must ask ourselves how likely is it that if H. naledi truly is human, then why does it have so many australopith characteristics?
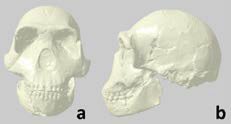
Figs. 1a and b. 3D mesh image of the skull and mandible of H. naledi. Note that the middle section of the face is missing, and has been reconstructed, including the nasal bones. www.MorphoSource.org hosted by Duke University. (Credit: University of Witwatersrand and Dinaledi project.)
Other creationists oppose this view that H. naledi is human, but rather a species of ape. For example, according to David Menton (Mitchell 2015), the sloping face, the large mandibles, the small cranium, and the curved finger bones show that H. naledi is an ape and not human. David Menton lists five basic cranial morphological characteristics based on which humans can easily be distinguished from apes. These differences are (human vs. ape): large/ small cranium, round/flat forehead, open/closed eye sockets when viewed from the side, vertical/sloped face, presence/absence of protruding nasal bones (DeWitt, Habermehl, and Menton 2010). Indeed, what is interesting about one of the skull fragments of H. naledi found by the discoverers is that the mid-section of the face is missing, which has been reconstructed with plaster showing slightly jutting nasal bones, which is characteristic of modern humans, as opposed to a flat nose like what we see in apes. Since H. naledi has been thought by many evolutionary anthropologists to be the direct predecessor of humans, this could possibly be the reason they depicted H. naledi with supposed protruding nasal bones, which is characteristic of humans. However, since the nasal bones are missing, we cannot be sure what it really looked like. Indeed, if for example we examine the skull of H. naledi (figs. 1a and b) we can see that H. naledi shows australopithecine characteristics: sloped lower face, flat forehead, small cranial volume (estimated to be between 465 cc and 560 cc compared to 1100–1500 cc for modern humans); furthermore, the orbits of the eyes are not plainly visible from the side.
Since this study takes postcranial characteristics of H. naledi into consideration, and since many of these postcranial characteristics resemble those of australopithecines (Wise 2016) (long curved fingers for climbing, flared pelvis, pyramidal ribcage, and small skull size, well outside the range of humans) I have chosen to reconsider the taxonomic categorization of H. naledi.
A total of 57 craniodental characteristics listed in Berger et al. (2010) formed the basis of my previous analysis. The majority of these are dental characteristics, which means that these types of characteristics were obviously over-represented, thereby possibly skewing the results. Therefore 30 measurements were analyzed which were taken from the hand of six species: 1) H. naledi, 2) H. sapiens, 3) H. neanderthalensis, 4) Australopithecus afarensis, 5) A. africanus, and 6) A. sediba, and six measurements taken from the foot of H. naledi, H. sapiens, and A. afarensis and sediba. I also added the five main cranial characteristics discussed by Dave Menton. Three other characteristics not analyzed in the previous study such as the australopithecine-like shoulder, the distally wide ribcage and the curled fingers have been analyzed here. In total this made 99 data points. An overview of these data points can be seen in Table 1.
| Major Anatomic Region/Subregion | Number of Characteristics |
|---|---|
| Craniodental | 62 |
| –cranium | 18 |
| –maxilla | 21 |
| –mandibles | 23 |
| Postcranial | 37 |
| –hands | 29 |
| –feet | 6 |
| –thorax | 2 |
| Ribcage shape | 1 |
| Shoulder type | 1 |
The goal of this study in particular was to assess whether the taxonomical position of H. naledi would change based on new postcranial data added to the already known craniodental measurements. Although the same postcranial measurements are available for only a smaller number of species compared to the previous analysis (six versus 14), here the main question was whether H. naledi could possibly be reclassified based on more robust data or not.
While only six species were used on this analysis, this was due to the lack of postcranial data, which was not available for the other eight species (P. aethiopicus, P. boisei, P. robustus, A. namensis, H. erectus, H. habilis, H. rudolfensis, and H. heidelbergensis) in the previous analysis of H. naledi (O’Micks 2016). Similarly, though postcranial exists for several outlier species (such as G. gorilla, P. pygmaeus, and P. troglodytes), these species didn’t have any craniodental data in the Berger study. Therefore, the results presented in this study should be viewed as tentative, since after acquiring more data, gaps between different species might be filled in by adding new species.
Methods
The data matrix used in the previous study (O’Micks 2016) was augmented with data for the six species listed in the analysis (the original craniodental data originally came from Wood 1991). Twenty-eight measurements from Kivell et al. 2015 regarding hand measurements and six foot measurements from Harcourt-Smith et al. 2015 were added to the matrix. The five cranial characteristics of Menton and the three other morphological characteristics were given a value of 1 or 2, meaning either present or not present, and/or if it resembled humans or australopithecines, or otherwise {1,2} if present in both forms in a given species. The data was transformed similarly to O’Micks 2016, except that a scaling factor of 1.999 was used instead of 3.999 in the equation used to transform the data points to integers between zero and two:
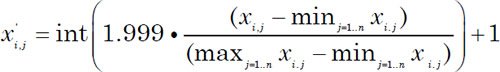
This was done, since by using a lower scaling factor, closer distances, more significant correlations, and higher bootstrap values were obtained due to a lower variation in the integer values.
The data matrixes were then entered into the BDIST program at http://www.coresci.org/bdist.html (Robinson and Cavanaugh 1998; Wood 2005, 2008) to obtain baraminic distance correlations, correlation graphs, probabilities, and bootstrap values. A relevance cutoff of 0.95 was selected for both analyses. Eighty-three of the 99 characteristics were retained in the analysis. The data points were calculated in three-dimensional character space using multidimensional scaling (MDS), also available in the online program package by Wood (2008), and visualized using Kinemage software (available at http://kinemage.biochem.duke.edu/software/mage.php). Figs. 1a and b correspond to image M7300-8170 at the MorphoSpace website.
A partial version of the BDIST software was created by the author and was uploaded to GitHub at the following web address: https://github.com/jeanomicks/bdist_weighted. This version calculates baraminic distances based on weighting the individual characters in the data matrix used as input. An extra row at the bottom of the input matrix designates the weights for each character.
Results
Compared to the previous analysis (O’Micks 2016) of the taxonomic position of H. naledi, relationships between the six analyzed species changed quite a bit. Whereas previously A. africanus and A. afarensis are correlated with a value of 0.558, a baraminic distance of 0.531, and bootstrap value of 77%, these values now have significant values. The correlation value is now 0.93, the baraminic distance is 0.176, and the bootstrap value is now 91+%. In the previous study, H. sapiens and H. neanderthalensis had a correlation value of 0.535, a baraminic distance of 0.562, with a low bootstrap value of 57. These values are now more significant in that the correlation value is now 0.936, the baraminic distance is 0.176, with a significant bootstrap value of 93+%. A. sediba and H. naledi only had a correlation value of 0.103, a baraminic distance of 0.667, and a bootstrap value of 98%. The correlation value is now 0.379, the baraminic distance is 0.353, with a bootstrap value of 98%. As a general trend we can see that the relationships between these three pairs of species all became more significant, albeit now the correlation between A. sediba and H. naledi is moderate.
In the present analysis, it is important to note how H. naledi relates to the other five species. Interestingly, it has a negative correlation of −0.359 and −0.526 with A. afarensis and africanus, respectively. With H. sapiens and H. neanderthalensis the correlation values are 0.002 and 0.118, which are uninformative. The baraminic distances between H. naledi and the previous species is 0.569, 0.667, 0.51, and 0.49, with significant bootstrap values all of which are >90%.
Fig. 2 is a spatial depiction of the baraminic relationships between the six species based on the 3D MDS coordinates calculated by the BDIST program. Fig. 3 represents a stress graph, with a minimum stress value for two groups, with a minimum stress value of less than 0.055 at three dimensions. What can be seen is that the two Homo species cluster well together apart from H. naledi and A. sediba as well as A. africanus and A. afarensis forming somewhat loose clusters of species away from the two Homo species. Here the discontinuity between (H. sapiens + H. neanderthalensis) and (Australopithecines + H. naledi) can be seen quite well.
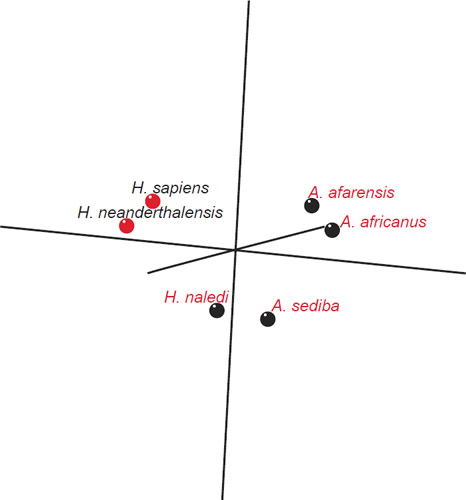
Figs. 2. Fig. 2. Baraminic relationships according to 3D MDS coordinates. The coloring of the dots represents the different groups determined by the BDC results. Red: H. sapiens, H. neanderthalensis. Black: A. africanus, A. afarensis, A. sediba, H. naledi.
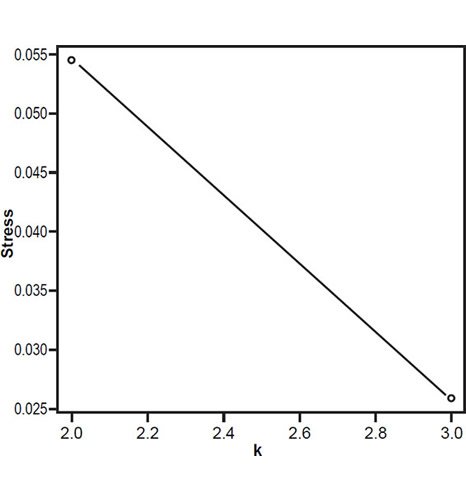
Figs. 3. Stress graph showing stress values at different dimensions. The minimum stress value is at three dimensions.
A version of the BDIST program (Wood and Murray, 2003) was devised which assigns a weight between 0 and 1 to each character. Both the unweighted and the weighted distances and correlation values can be seen in Supplementary Excel File #1. As we can see, the distance between H. naledi and A. sediba dropped from 0.353 to 0.344, whereas the distance increased from 0.49 to 0.531 and from 0.507 to 0.542 between H. naledi and H. neanderthalensis and H. sapiens, respectively, if we assign weights of 42/57 ≈ 0.74 for each of the craniodental characteristics. This value was chosen so that both the 57 craniodental and the 42 postcranial characters would be represented with exactly equal total weight, in order to represent both craniodental and postcranial features equally.
It is also interesting to note that after taking postcranial characteristics into consideration, the baraminic distance between H. naledi and A. sediba dropped from the previous analysis from 0.667 to roughly half the value, 0.353 in the present study and dropped even further to 0.344 when using the weighted version of the BDIST program. The baraminic distances between H. naledi and H. neanderthalensis and H. sapiens also dropped slightly, but increased again when the weighted version of BDIST was used. These results are summarized in Tables 2 and 3. What is also remarkable is that the baraminic distances also dropped between H. naledi and A. afarensis and A. africanus, and dropped even further when weighting was applied. This suggests that when taking further data into consideration, with proper weighting, H. naledi appears to be more australopithecine in nature.
| A. afarensis | A. africanus | A. sediba | H. neanderthalensis | H. sapiens | |
|---|---|---|---|---|---|
| Craniodental | 0.969 | 0.938 | 0.667 | 0.531 | 0.594 |
| Craniodental + Postcranial | 0.667 | 0.569 | 0.353 | 0.471 | 0.510 |
| Weighted Craniodental + Postcranial | 0.625 | 0.509 | 0.344 | 0.507 | 0.542 |
| Postcranial only (craniodental weight = 0) | 0.364 | 0.136 | 0.318 | 0.773 | 0.727 |
| A. afarensis | A. africanus | A. sediba | H. neanderthalensis | H. sapiens | |
|---|---|---|---|---|---|
| Craniodental | −0.689 | −0.649 | 0.103 | 0.634 | 0.460 |
| Craniodental + Postcranial | −0.526 | −0.359 | 0.379 | 0.118 | 0.002 |
| Weighted Craniodental + Postcranial | −0.338 | −0.126 | 0.433 | 0.048 | −0.173 |
| Postcranial only (craniodental weight = 0) | 0.692 | 0.960 | 0.790 | −0.858 | −0.837 |
The baraminic correlation increased between H. naledi and A. sediba when postcranial data was added to the character matrix, from 0.103 to 0.379, and even further when a weight of 0.74 was applied to the craniodental characteristics to 0.433. Correlation values also changed between H. naledi and A. africanus, from −0.649 to −0.359 (postcranial) to −0.126 (postcranial + weight = 0.74). For H. sapiens, the trend was to change from 0.46 to 0.002 (postcranial) to 0.173 (postcranial + weight = 0.74).
Discussion
By adding 36 new characteristics describing the hand and feet of six species as well as three other characteristics (table 1), as well as reducing the number of possible character states from five to three, a more robust analysis of H. naledi compared to the genus Homo and Australopithecus was made possible. This facilitated a more precise baraminic categorization of H. naledi, with generally higher correlation values and higher bootstrap values.
What we can see is that, as in the previous analysis of O’Micks (2016), H. sapiens and H. neanderthalensis belong to the same monobaramin, and A. africanus and A. afarensis belong in a separate monobaramin. However, the position of A. sediba and H. naledi have changed. A. sediba shows a moderately negative correlation to the members of the Homo monobaramin (−0.68 with H. neanderthalensis, and 0.739 with H. sapiens), while it shows a weak positive correlation with the two members of the Australopithecus monobaramin (0.288 with A. afarensis, and 0.366 with A. africanus). In contrast, H. naledi shows a moderate negative correlation to the members of the Australopithecus monobaramin (−0.526 with A. afarensis, and −0.359 with A. africanus), but shows neither continuity nor discontinuity with the members of the Homo monobaramin (correlation values of 0.118 with H. neanderthalensis, and 0.002 with H. sapiens). At the same time these two species show a moderate correlation with each other (0.379). This can be seen in the baraminic correlation matrix depicted in Fig. 4.
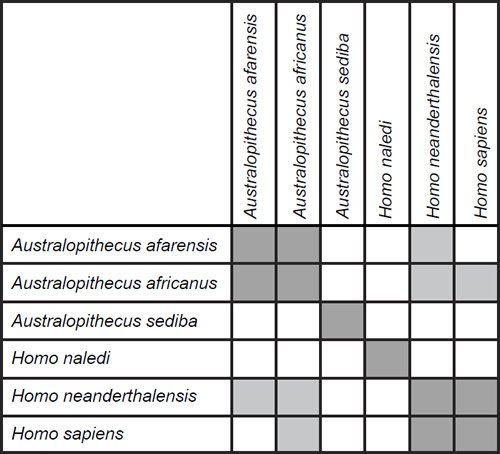
Figs. 4. Baraminic distance correlation matrix for three Australopithecus species and three Homo species. Dark gray boxes show that two species are significantly positively correlated (interpreted as evidence of continuity, that they belong to the same baramin). Light gray boxes show that two species are significantly negatively correlated (interpreted as evidence of discontinuity, that they belong to different baramins, or of distant positions within an array of taxa connected by continuity and hence cobaraminic).
One of the main results of this analysis is that there is now a moderate correlation between A. sediba and H. naledi compared to previous results. A study by Dembo et al. (2016) assigning a date to the fossils also showed similar results. Interestingly, some of the results of Wood’s (2016) re-analysis of the human holobaramin also support this finding. In his analysis, there is a significant continuity between H. naledi, A. sediba, as well as H. habilis and H. erectus, which form a monobaramin within his proposed human holobaramin. In this paper he mentioned several cranial characteristics that A. sediba and H. naledi share with Australopithecus, but not with Homo, such as small cranial capacity (420–440 cc for A. sediba; Berger et al. 2010; Carlson et al. 2011), marked development of the canine jugum, and a maxilla-alveolar index which is longer than it is wide, a lateral entoglenoid process, and an intermediate petrous orientation. Postcranially, H. naledi and A. sediba also share a number of characteristics, which will be discussed in the following sections.
The upper limbs and hand
The hand of H. naledi and A. sediba has long, curved fingers. The hand of H. naledi has some characteristics which are similar to the wrist and palm of modern humans and Neanderthals (Kivell et al. 2015). The mosaic nature of the hand of H. naledi has led some evolutionists to suggest that the curved fingers are retentions from an arboreal ancestor now being lost, but this is contradicted by the fact that its fingers are even more curved than some australopithecines. Furthermore, the upper limb and thorax of H. naledi also suggest that it was suited for arboreal locomotion. Kivell et al. (2015) also argue that the derived thumb and wrist features made H. naledi suitable for precision tool making and use; however, no tools were found in the Dinaledi chamber where H. naledi was found. Alternatively, A. sediba also shows anatomic upper limb features which, similarly to H. naledi, suggest arboreal locomotion. These include relatively high shoulders, pronounced clavicular conoid tubercules, high brachial index, moderately keeled ulnar trochlea, and the moderately curved manual phalanges (Churchill et al. 2013). Some characteristics possibly show signs of tool use, such as a human-like palmar pad with a mobile proximal pulp, and a derived abductor digiti minimi (ADM) (Kivell et al. 2011).
The thorax
The ribcage of H. naledi is distally wide, which is a very common characteristic of australopithecines. The thorax of A. sediba also follows this basic pattern, although besides the narrow upper thorax, its pelvis and lower thorax is also narrow (Schmid et al. 2013; Williams et al. 2013). This transformation of the funnel-shaped thorax of australopithecines towards the barrel-shaped thorax of humans is viewed by evolutionists as a transition between arboreal climbing/suspension and terrestrial bipedalism. However, the supposed stem species of all hominins, Ardipithecus ramidus, has also been argued to have a derived, barrel-shaped thorax like humans (Lovejoy et al. 2009), meaning that there is no clear evolutionary trajectory here.
The feet
The foot of both H. naledi and A. sediba show modern human-like characteristics. For H. naledi these include an adducted hallux, an elongated tarsus, a derived ankle, and calcaneocuboid joints. However, the proximal pedal phalanges are curved, which is more characteristic of australopithecines (Harcourt-Smith et al. 2015). In A. sediba, terrestrial bipedality is achieved by hyperpronation, based on its arched foot, long plantar ligaments, enlarged talar head (DeSilva et al. 2013; Zipfel et al. 2011). Furthermore, we should also add that human-like feet also occur in embryonic form in chimpanzee and gorilla. According to Coon (1954), “The embryo of a chimpanzee at one stage has a foot resembling that of man in that its great toe points forward for walking rather than backward for grasping. Only as it approaches its birth does its foot acquire the appearance of a hand. At no stage of its development does the human foot resemble that on an adult ape.”
The age of the fossils
The H. naledi fossils were found very near to the surface of the ground suggesting that the fossils are quite young—H. naledi could definitely not be the predecessor of modern humans if it is seemingly so recent. H. naledi has not yet been assigned a date for about three years now. According to a recent estimate involving Bayesian inferences based on phylogenetic tress, the supposed evolutionary age of H. naledi has been estimated to be 912 ka (Dembo et al. 2016). In comparison, H. erectus fossils have been dated at 1.5 Ma (Zaim et al. 2011), yet H. naledi is thought to be basal to the genus Homo, thereby preceding H. erectus.
Analysis using weights for specified characters
Besides statistical analysis it is apparent that knowledge of important and less important morphological characters also carries weight in order to give a more holistic description of a given species. I suggest that further baraminological distance algorithms could assign weights to different characters in relation to their importance if warranted. That is why a weighted version of the BDIST software was devised as a part of this study. For example, a human baramin analysis would be skewed if for example, more than one half of all characters described only dental features. As we see in the Berger et al. (2010) study, characters such as “maxilloalveolar length” and “maxilloalveolar breadth” might not bring so much new information to the character matrix, or for example “symphysis area” could already be determined partially by “symphysis height” and “symphysis width” so as to be redundant.
Therefore, in order to get a picture of how baraminic distances and correlations can change according to weighting certain characters, the weighted version of the BDIST program (bdist_weighted.pl) was run on the character matrix with weights ranging from 0.1 to 1.0 in intervals of 0.1 for the 57 craniodental characters. The program accepts the relevance cutoff as a parameter, therefore each of the weight values were combined with relevance cutoff values of 0.75, 0.8, 0.85, 0.9, and 0.95 for five species, A. africanus, A. afarensis, A. sediba, H. neanderthalensis, and H. sapiens. The 50 distance and correlation values were displayed for each of the five species (Figs. 5a–e; Figs. 6a–e). The distance and correlation values are available in Supplementary Excel File #2.
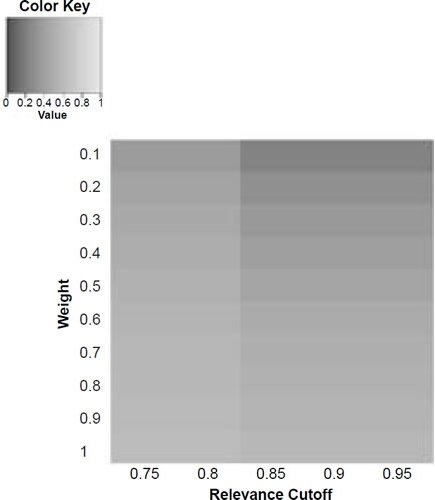
Figure 5a. Baraminic distance between H. naledi and A. africanus according to relevance cutoff and weighting of craniodental features.
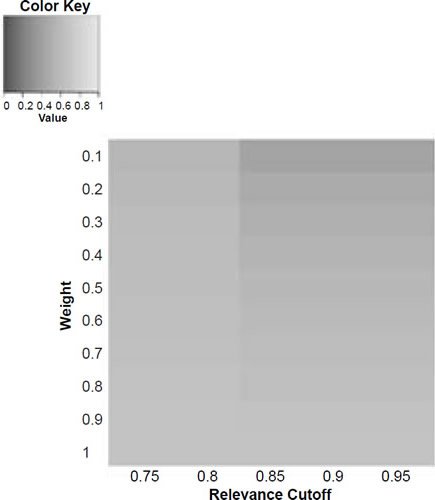
Figure 5b. Baraminic distance between H. naledi and A. afarensis according to relevance cutoff and weighting of craniodental features.
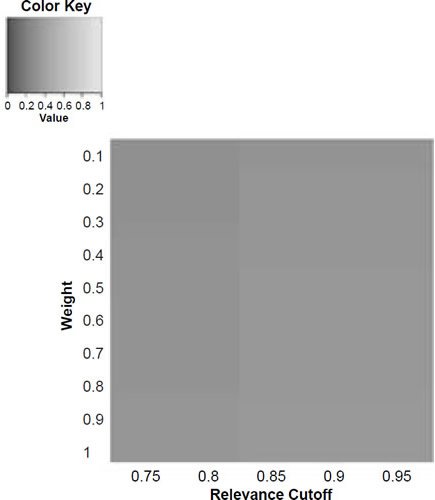
Figure 5c. Baraminic distance between H. naledi and A. sediba according to relevance cutoff and weighting of craniodental features.
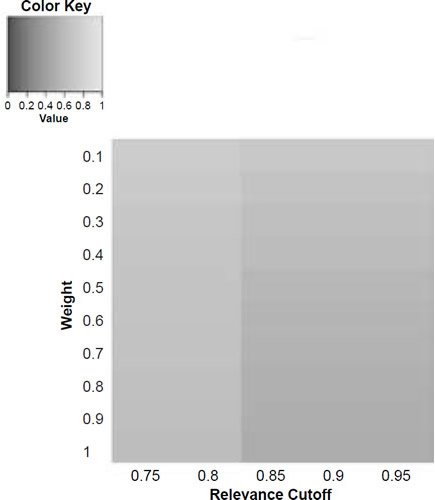
Figure 5d. Baraminic distance between H. naledi and H. neanderthalensis according to relevance cutoff and weighting of craniodental features.
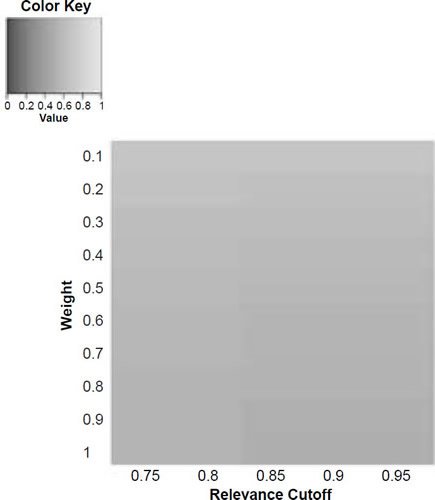
Figure 5e. Baraminic distance between H. naledi and H. sapiens according to relevance cutoff and weighting of craniodental features.
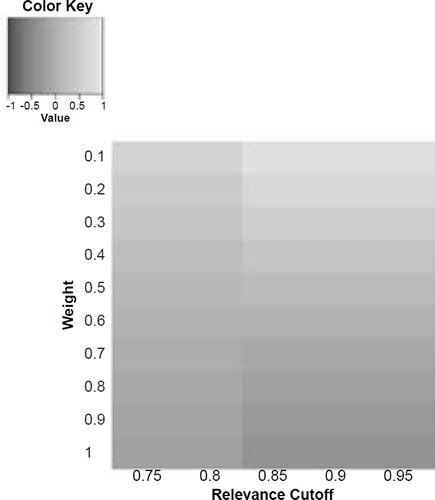
Figure 6a. Baraminic correlation between H. naledi and A. africanus according to relevance cutoff and weighting of craniodental features.
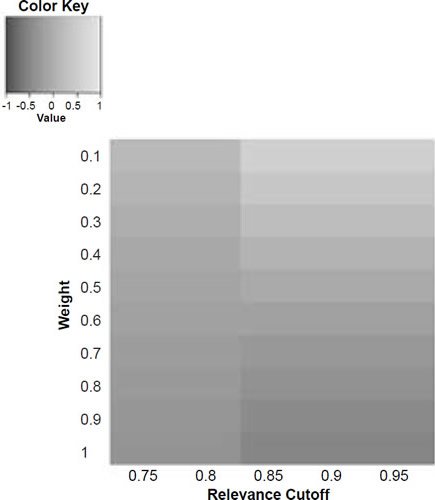
Figure 6b. Baraminic correlation between H. naledi and A. afarensis according to relevance cutoff and weighting of craniodental features.
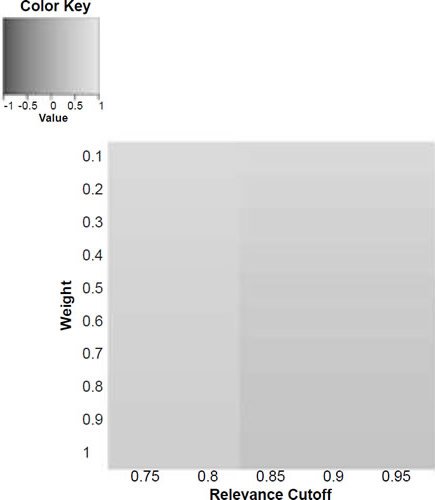
Figure 6c. Baraminic correlation between H. naledi and A. sediba according to relevance cutoff and weighting of craniodental features.
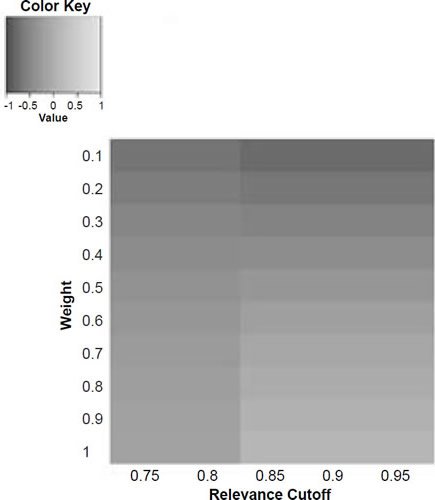
Figure 6d. Baraminic correlation between H. naledi and H. neanderthalensis according to relevance cutoff and weighting of craniodental features.

Figure 6e. Baraminic correlation between H. naledi and H. sapiens according to relevance cutoff and weighting of craniodental features.
What we can see as a general trend is that as the weights for the craniodental characters decreased, so the baraminic distance between H. naledi and the three australopithecine species decreased. At a relevance cutoff of 0.95 and a weight of 0.1, this distance decreased to 0.25, 0.426, and 0.325 between H. naledi and A. africanus, A. afarensis, and A. sediba, respectively. In contrast, the baraminic distance increased between H. naledi and H. neanderthalensis and H. sapiens to 0.715 and 0.683 at these identical parameter values.
As for the correlation values we see that at a relevance cutoff of 0.95 and a weight of 0.1, the correlation between H. naledi and A. africanus, A. afarensis, and A. sediba was 0.858, 0.563, and 0.737, respectively, which are all moderate or even strong correlations. In contrast, the baraminic correlation dropped between H. naledi and H. neanderthalensis and H. sapiens to −0.78 and −0.781 at these identical parameter values.
Lowering the weight value for craniodental characters to 0.1 might seem drastic, yet as mentioned above, craniodental characters might indeed be overrepresented compared to postcranial characters (62 versus 37), and also redundant. A smaller character weight for craniodental characters could be warranted, however, since the skull makes up a smaller region of the body as a whole. Postcranial characters were also measured mainly for the hand and the foot (35 of 37 characters), which means that underrepresented. However, by lowering the weight value we were still able to show a lower distance between H. naledi and the three Australopithecus species, and a higher distance between it and the genus Homo. Furthermore, this way there was a moderate to strong positive correlation between H. naledi and the three Australopithecus species, and a moderately negative correlation between it and the genus Homo, showing that H. naledi segregates away from Homo towards the Australopithecus holobaramin.
Conclusion
Based on this baraminological analysis, by adding postcranial data to the earlier character matrix, we can see that H. naledi groups away from the Homo genus, and more towards A. sediba. Whatever robust continuities it had with Homo in the previous analysis are now gone, yet its connections to the Australopithecus baramin have not yet been well established.
It is also interesting that both H. naledi and A. sediba were discovered in South Africa by Lee Berger, seven years apart. Similarities between these two species in the structure of the upper limb, thorax, and feet suggest that they might be similar, if not the same species of australopithecine. The australopithecine nature of H. naledi is also suggested by its mixed modes of locomotion, “derived” for terrestrial bipedality as well as elongated phalanges in the hand suited for arboreal locomotion (Harcourt-Smith 2016).
These evidences suggest that H. naledi might indeed not be part of the Homo holobaramin, but could rather be a member of the Australopithecus baramin, possibly a relative of A. sediba.
References
Berger, L. R., D. J. de Ruiter, S. E. Churchill, P. Schmid, K. J. Carlson, P. H. Dirks, and J. M. Kibii. 2010. “Australopithecus sediba: A New Species of Homo-like Australopith from South Africa.” Science 328 (5975): 195–204.
Carlson, K. J., D. Stout, T. Jashashvili, D. J. de Ruiter, P. Tafforeau, K. Carlson, and L. R. Berger. 2011. “The Endocast of MH1, Australopithecus sediba.” Science 333 (6048): 1402–1407.
Churchill, S. E., T. W. Holliday, K. J. Carlson, T. Jashashvili, M. E. Macias, S. Mathews, T. L. Sparling, P. Schmid, D. J. de Ruiter, and L. R. Berger. 2013. “The Upper Limb of Australopithecus sediba.” Science 340 (6129): 1233477.
Coon, C. S. 1954. The Story of Man. New York, New York: Alfred A. Knopf.
Dembo, M., D. Radovčić, H. M. Garvin, M. F. Laird, L. Schroeder, J. E. Scott, J. Brophy, et al. 2016. “The Evolutionary Relationships and Age of Homo naledi: An Assessment Using Dated Bayesian Phylogenetic Methods.” Journal of Human Evolution 97: 17–26.
DeSilva, J. M., K. G. Holt, S. E. Churchill, K. J. Carlson, C. S. Walker, B. Zipfel, and L. R. Berger. 2013. “The Lower Limb and Mechanics of Walking in Australopithecus sediba.” Science 340 (6129): 1232999.
DeWitt, D., A. Habermehl, and D. Menton. 2010. “Baraminological Analysis Places Homo habilis, Homo rudolfensis, and Australopithecus sediba in the Human Holobaramin.” Answers Research Journal 3: 71–90.
Harcourt-Smith, W. E., Z. Throckmorton, K. A. Congdon, B. Zipfel, A. S. Deane, M. S. M. Drapeau, S. E. Churchill, L. R. Berger, and J. M. DeSilva. 2015. “The Foot of Homo naledi.” Nature Communications 6: 8432.
Harcourt-Smith, W. E. H. 2016. “Early Hominin Diversity and the Emergence of the Genus Homo.” Journal of Anthropological Sciences 94: 19–27.
Hartley, R. 2015. “Some Bones to Pick.” Times Live, 18 September. http://www.timeslive.co.za/thetimes/2015/09/18/Some-bones-to-pick.
Kivell, T. L., J. Kibii, S. E. Churchill, P. Schmid, and L. R. Berger. 2011. “Australopithecus sediba Hand Demonstrates Mosaic Evolution of Locomotor and Manipulative Abilities.” Science 333 (6048): 1411–1417.
Kivell, T. L., A. S. Deane, M. W. Tocheri, C. M. Orr, P. Schmid, J. Hawks, L. R. Berger, and S. E. Churchill. 2015. “The Hand of Homo naledi.” Nature Communications 6: 8431.
Line, P. 2015. “The Puzzling Homo naledi: A Case of Variation or Pathology in Homo erectus?” http://creation.com/ puzzling-homo-naledi.
Lovejoy, C. O., G. Suwa, L. Spurlock, B. Asfaw, and T. D. White. 2009. “The Pelvis and Femur of Ardipithecus ramidus: The Emergence of Upright Walking.” Science 326 (5949): 71–71e16.
Mitchell, E. 2015. “Is Homo naledi a New Species of Human Ancestor?” Answers in Depth 10.
O’Micks, J. 2016. “Preliminary Baraminological Analysis of Homo naledi and its Place within the Human Baramin.” Journal of Creation Theology and Science Series B: Life Sciences 6: 31–39.
Robinson, D. A., and D. P. Cavanaugh. 1998. “A Quantitative Approach to Baraminology With Examples from the Catarrhine Primates.” Creation Research Society Quarterly 34 (4): 196–208.
Schmid, P., S. E. Churchill, S. Nalla, E. Weissen, K. J. Carlson, D. J. de Ruiter, and L. R. Berger. 2013. “Mosaic Morphology in the Thorax of Australopithecus sediba.” Science 340 (6129): 1234598.
Stringer, C. 2015. “Human Evolution: The Many Mysteries of Homo naledi.” Elife 4: e10627.
Williams, S. A., K. R. Ostrofsky, N. Frater, S. E. Churchill, P. Schmid, and L. R. Berger. 2013. “The Vertebral Column of Australopithecus sediba.” Science 340 (6129): 1232996.
Wise, K. P. 2016. “Paleontological Note on Homo naledi.” Journal of Creation Theology and Science Series B: Life Sciences 6: 9–13.
Wood, B. 1991. Koobi Fora Research Project IV: Hominid Cranial Remains from Koobi For a. Oxford, United Kingdom: Clarendon.
Wood, T. C., and M. J. Murray 2003. Understanding the Pattern of Life: Origins and Organization of the Species. Nashville, Tennessee: Broadman & Holman.
Wood, T. C. 2005. “Visualizing Baraminic Distances Using Classical Multidimensional Scaling.” Origins (GRI) 57: 9–29.
Wood, T. C. 2008. BDISTMDS software. v. 2.0. Dayton, Tennessee: Core Academy of Science.
Wood, T. C. 2016. “An Evaluation of Homo naledi and “Early” Homo from a Young-Age Creationist Perspective.” Journal of Creation Theology and Science Series B: Life Sciences 6: 14–30.
Zaim, Y., R. L. Ciochon, J. M. Polanski, F. E. Grine, E. A. Bettis III, Y. Rizal, R. G. Franciscus, et al. 2011. “New 1.5 Million- Year-Old Homo erectus Maxilla from Sangiran (Central Java, Indonesia).” Journal of Human Evolution 61(4): 363–376.
Zipfel, B., J. M. DeSilva, R. S. Kidd, K. J. Carlson, S. E. Churchill, and L. R. Berger. 2011. “The Foot and Ankle of Australopithecus sediba.” Science 333 (6048): 1417–1420.
Supplementary Files
Supplementary Table 1. Combined data set from Tables 1 and 2 from Berger et al. (2015), Kivell et al. (2015) and Harcourt-Smith et al. (2015), 0.95 cutoff.
Supplementary Table 2. Correlation matrix A. africanus, A. afarensis, A. sediba, H. neanderthalensis, H. sapiens.