The views expressed in this paper are those of the writer(s) and are not necessarily those of the ARJ Editor or Answers in Genesis.
Abstract
Encephalization is the perceived process of brain size increase during evolution. However, this process is oversimplified. Previous results from the analysis of the encephalization residual show that significant ER exists only for all members of the genus Homo, except for Homo naledi, but also for Australopithecus sediba and Australopithecus africanus. Analyzing the same data set, plotting mean endocranial volume as a function of mean body weight and applying Ward hierarchical clustering shows that six species of Homo segregate from two species of Homo, three species of Australopithecus, two species of Paranthropus, and Ardipithecus ramidus. These two species of Homo include Homo naledi and Homo habilis. This serves as further evidence supporting the idea that H. naledi should be classified as an ape and is non-human.
Keywords: Homo naledi, Australopithecus, endocranial volume, body mass, encephalization, baramin
Introduction
According to the popular concept of hominin evolution, endocranial volume (ECV) increases from more primitive species to more developed ones according to evolutionary time. This process is known as encephalization, and evolutionists claim that measurements for primate species is a proof of evolution (Matzke 2006). This concept however, is oversimplified, as in the case of the Neanderthals which have a larger ECV than Homo sapiens (Bruner, Manzi, and Arsuaga 2003). Furthermore, it has been shown that ECV also scales with body mass (Martin 1981).
Recently Wood (2016) analyzed ECV and body mass data for primates from data sets compiled by Isler et al. (2008), Schoenemann (2013) and De Miguel and Henneberg (2001). Here we must note that measurements of cranial capacity can be influenced by bias, and that the body mass measurements in these studies are also estimates, thus the results in this paper are tentative, contingent upon the accuracy of these estimates and measurements. In Figure 2 of his paper, Wood depicted the relationship between the log(ECV [cc]) value as a function of the log(body mass [g]) value based on a linear model (Wood 2016). Furthermore, it was found that the endocranial residual (ER) value, calculated as the difference between the expected and observed log(ECV) values followed a normal distribution, with a mean value of −8.3∙10-18 and a standard deviation of 0.1194. Based on this normal distribution, different species could be shown to have a significant ER value if their value was either less than −0.234 or greater than 0.234 at the 2.5% level.
Homo naledi showed a non-significant ER value of 0.201, with a p-value of 0.046, due to a moderate body mass but an unusually small cranium. Also, Australopithecus africanus has a significant ER value of 0.201 (p = 0.0079). The value of the analysis is that it shows that although there may be a smooth transition in ECV from Ardipithecus ramidus to Homo sapiens, ER increases much more abruptly than ECV, from A. africanus to H. sapiens, and then another abrupt increase before Homo sapiens/neanderthalensis/heidelbergensis.
| Species | Mean Endocranial Volume (cc) | Mean Body Mass (kg) | Cluster No. |
|---|---|---|---|
| Aridipithecus ramidus | 300.0 | 50.0 | 2 |
| Australopithecus afarensis | 419.5 | 30.4 | 2 |
| Paranthropus aethiopicus | 410.0 | 37.7 | 2 |
| Paranthropus boisei | 503.3 | 53.1 | 2 |
| Australopithecus africanus | 441.7 | 27.2 | 2 |
| Australopithecus sediba | 420.0 | 25.8 | 2 |
| Homo naledi | 545.0 | 42.8 | 2 |
| Homo habilis | 609.3 | 32.6 | 2 |
| Homo rudolfensis | 788.5 | 45.6 | 1b |
| Homo ergaster | 800.7 | 58.3 | 1b |
| Homo erectus | 960.1 | 63.4 | 1b |
| Homo heidelbergensis | 1231.6 | 98.9 | 1a |
| Homo neanderthalensis | 1391.4 | 84.5 | 1a |
| Homo sapiens | 1463.8 | 64.7 | 1a |
Results and Discussion
The mean ECV (cc) was plotted for 14 taxa taken from Wood’s analysis (Wood 2016) as a function of mean body mass (kg). The results can be seen in Fig. 1. Clustering was performed using Ward’s hierarchical clustering. As we can see, two or three clusters are visible, depending on how deep the cutoff is for the clustering. With two clusters, the first main cluster is made up of Homo sapiens, Homo neanderthalensis, Homo heidelbergensis + Homo rudolfensis, Homo erectus, and Homo ergaster. The second cluster is made up of Homo habilis, Homo naledi, Australopithecus sediba, Australopithecus africanus, Australopithecus afarensis, Paranthropus boisei, Paranthropus aethiopicus, and Ardipithecus ramidus. Using a Student’s t-test, the p-value for the ECV values for the two clusters is 0.0023, which is highly significant even at the 1% level.
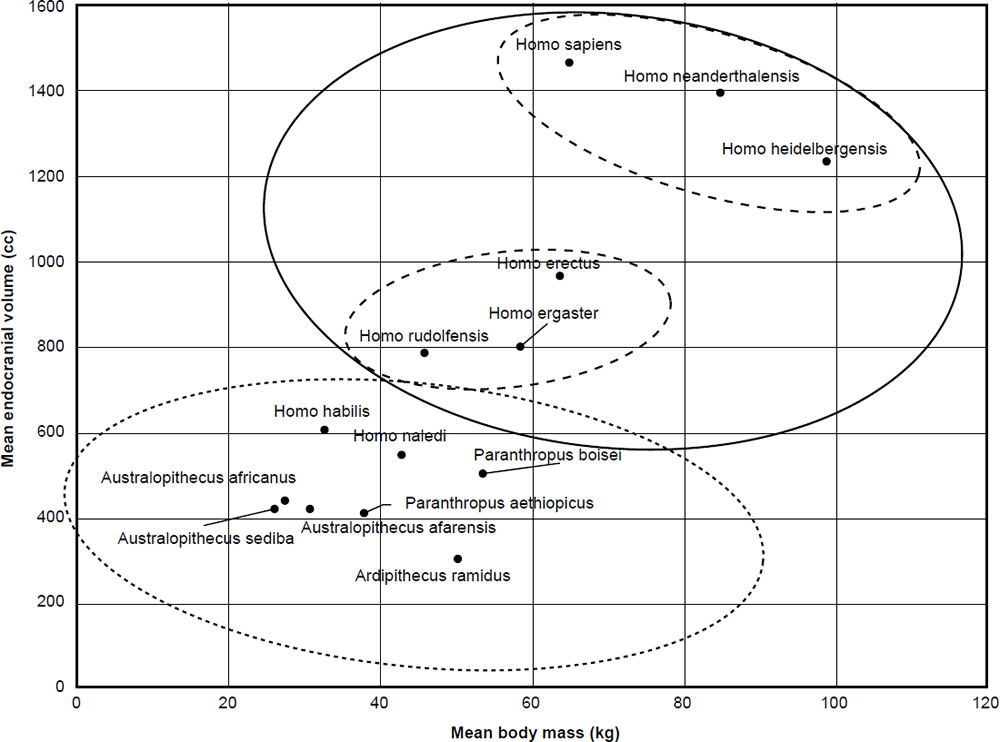
Fig. 1. Mean endocranial volume of the 14 hominin species according to mean body mass from Table 1.
As to whether the first cluster can be split into two subclusters or not, the fact still remains that eight species, including H. habilis, H. naledi, and A. sediba both belong to the same cluster, at least based on ECV and body mass. Therefore, baraminic discontinuity exists between these three species and humans in this aspect.
Despite the majority view of H. naledi being at the base of the genus Homo and possibly being a transition species between the genus Australopithecus and Homo, other views dissent. Jeffrey Schwartz, professor of anthropology at the University of Pittsburgh thinks that the fossil remains of H. naledi are a mixture of multiple species, based on differences in skull shape in three of the specimens (Callaway 2015). Also, a recent set of analyses based on Principal Component Analysis of 8–12 species of the original data set of Berger et al. (2015) by Neves, Bernardo, and Pantaleoni (2017) showed that H. habilis, H. naledi, and A. sediba belong to the same clade. In both studies, principal component 1 of 2 was influenced by cranial capacity, among other factors. It has been the majority creationist view that H. habilis was not human. For example, Lubenow refers to the remains of H. habilis being a mix of human and non-human fossils (Lubenow 2004). Interestingly, Young classified H. habilis as an australopithecine based on its encephalization (Young 2006). Thus, since H. naledi groups with H. habilis, then transitively, H. naledi is not human, if indeed H. habilis can be assumed to be an australopithecine.
There is the possibility that the fossil remains of H. naledi were pathological, although what kind of disease these H. naledi specimens may have been suffering from goes unnamed. However, all 15 remains of H. naledi found in the Dinaledi chamber showed the same set of unusual hominin features. Thus, it would be unlikely that all of the H. naledi individuals had the same malformities in the same bones.
Thus, based on results from previous analyses of H. naledi (O’Micks 2016, 2017a, 2017b), and also the fact that H. naledi clusters together with species from the genera Australopithecus and Paranthropus based on encephalization tendencies dependent on body mass give further support to the idea that H. naledi is not a member of the human holobaramin, but is rather a species of ape, most likely an australopithecine. While it is true that just because a hominin species has a small cranial capacity does not automatically mean that it is an ape or less intelligent, the converse is also true, namely that it cannot be assumed that if a species has a small cranial capacity, then it is not an ape. Baraminology is based on additive evidence (Wood and Murray 2003), meaning that we can add species to a core set of species only if we show continuity between the new species and the already existing set of species. As opposed to this, the present analysis shows discontinuity between H. naledi and human species based not just on endocranial volume but also on body weight, assuming that the measured values in the data set for brain size and body mass are accurate.
Materials and Methods
Mean ECV (cc) and mean body mass (kg) were taken from Table 1 of Wood (2016) for 14 hominin taxa. Euclidean distances were calculated for the data and clustering was performed using the hclust function using the Ward hierarchical clustering method. Calculations were done in R version 3.4.1.
References
Berger, L. R., J. Hawks, D. J. de Ruiter, S. E. Churchill, P. Schmid, L. K. Delezene, T. L. Kivell, et al. 2015. “Homo naledi, a New Species of the Genus Homo from the Dinaledi Chamber, South Africa.” eLife 4: e09560.
Bruner, E., G. Manzi, and J. L. Arsuaga. 2003. “Encephalization and Allometric Trajectories in the Genus Homo: Evidence from the Neandertal and Modern Lineages.” Proceedings of the National Academy of Sciences USA 100 (26): 15335–15340.
Callaway, E. 2015. “Crowdsourcing Digs Up an Early Human Species.” Nature 525 (7569): 297–298.
De Miguel, C., and M. Henneberg. 2001. “Variation in Hominid Brain Size: How Much is Due to Method?” HOMO—Journal of Comparative Human Biology 52 (1): 3–58.
Hawks, J., M. Elliott, P. Schmid, S. E. Churchill, D. J. Ruiter, E. M. Roberts, H. Hilbert-Wolf, et al. 2017. “New fossil Remains of Homo naledi From the Lesedi Chamber, South Africa.” Elife 6: e24232. Matzke, N. 2006. http://www.pandasthumb.org/archives/2006/09/fun_with_homini.html.
Isler, K., E. C. Kirk, J. M. A. Miller, G. A. Albrecht, B. R. Gelvin, and R. D. Martin. 2008. “Endocranial Volumes of Primate Species: Scaling Analyses Using a Comprehensive and Reliable Data Set.” Journal of Human Evolution 55 (6): 967–978.
Lubenow, M. L. 2004. Bones of Contention. A Creationist Assessment of Human Fossils. Grand Rapids, Michigan: Baker Books.
Martin, R. D. 1981. “Relative Brain Size and Basal Metabolic Rate in Terrestrial Vertebrates.” Nature 293 (5827): 57–60.
Matzke, N. 2006. http://www.pandasthumb.org/archives/2006/09/fun_with_homini.html.
Neves, W. A., D. V. Bernardo, and I. Pantaleoni. 2017. “Morphological Affinities of Homo naledi with Other Plio-Pleistocene Hominins: A Phenetic Approach.” Anais da Academia Brasileira de Ciências 89: 1–9.
O’Micks, J. 2016. “Homo naledi Probably Not Part of the Human Holobaramin Based on Baraminic Re-Analysis Including Postcranial Evidence.” Answers Research Journal 9: 263–272. https://answersingenesis.org/human-evolution/homo-naledi-not-part-of-human-holobaramin/.
O’Micks, J. 2017a. “Rebuttal to ‘Reply to O’Micks Concerning the Geology and Taphonomy of the Homo naledi Site’ and ‘Identifying Humans in the Fossil Record: A Further Response to O’Micks’.” Answers Research Journal 10 (2017): 63–70. https://answersingenesis.org/human-evolution/ rebuttal-geology-taphonomy-of-homo-naledi-and-humans-in-fossil-record/.
O’Micks, J. 2017b. “Further Evidence That Homo naledi Is Not a Member of the Human Holobaramin Based on Measurements of Vertebrae and Ribs.” Answers Research Journal 10: 103–113. https://answersingenesis.org/human-evolution/further-evidence-homo-naledi-not-member-human-holobaramin/.
Schoenemann, P. T. 2013. “Hominid Brain Evolution.” In A Companion to Paleoanthropology. Edited by D. R. Begun, 136–164. Chichester, West Sussex: Blackwell Publishing.
Wood, T. C. 2016. “Estimating the Statistical Significance of Hominin Encephalization.” Journal of Creation Theology and Science Series B: Life Sciences 6: 40–45.
Wood, T. C., and M. J. Murray. 2003. Understanding the Pattern of Life: Origins and Organization of the Species. Nashville, Tennessee: Broadman & Holman.
Young, P. H. 2006. “Body Mass Estimates and Encephalization Quotients: A Fresh Look at the Australopithecines and Homo habilis.” Creation Research Society Quarterly 42 (4): 217–226.