
Research conducted by Answers in Genesis staff scientists or sponsored by Answers in Genesis is funded solely by supporters’ donations.
Abstract
Calculation of a mitochondrial DNA “clock” requires knowledge of an average generation time in a population or human ethnic group. Previous studies of the human mitochondrial DNA clock used a range of generation time estimates without any concrete knowledge of how generation times might vary by ethnicity. In this study, I document new data suggesting a historically faster generation time in Africans, which may explain why African people groups tend to harbor more mitochondrial DNA differences than non-African groups. These results underscore the biblical model of human origins in which the major ethnic groups originate simultaneously at the Tower of Babel event, and these findings simultaneously undercut the validity of the evolutionary out-of-Africa model.
Introduction
The young-earth creation (YEC) model and the evolutionary model differ significantly on the order and timing of the rise of modern human ethnic groups. A plain reading of Scripture indicates that the major ethnic groups present today likely originated simultaneously when languages were confused at the Tower of Babel event (Genesis 11:1–9). Furthermore, careful analysis of the biblical text places the date of the event around ~4000 years ago.1
By contrast, the evolutionary model puts the origin of African ethnic groups first, and dates this event at ~200,000 years ago (Gomez, Hirbo, and Tishkoff 2014). Following the evolution of Africans, evolutionists claim that a small subpopulation of humans migrated out of Africa tens of thousands of years later to give rise to the modern non-African people groups (Gomez, Hirbo, and Tishkoff 2014).
Both models have cited recent mitochondrial DNA (mtDNA) data in support of their positions. When assuming human-primate common ancestry and rooting the human mtDNA tree on chimpanzee mtDNA sequence, evolutionists have observed that African groups split off first before non-African groups (Ingman et al. 2000). Evolutionary ancestry assumptions aside, evolutionists have also pointed to the higher levels of mtDNA diversity in African people groups as consistent with the more ancient origin of Africans (Gomez, Hirbo, and Tishkoff 2014).
In contrast, previous analyses of human mitochondrial DNA (mtDNA) differences suggest the existence of a molecular “clock” that measures time consistent with the YEC timescale and at odds with the evolutionary timetable (Jeanson 2013, 2015a, 2015b). Nevertheless, because the mtDNA mutation rate had been measured only in non-African ethnic groups, in my prior studies I made conclusions about the origin of mtDNA differences in only these people groups, leaving the question of African origins unaddressed.
A careful reanalysis of the primary data from my most recent study (Jeanson 2015b) indicates that the mutation rate in non-Africans might be sufficient to explain mtDNA differences across all ethnic groups. Previously, I predicted that a constant rate of mutation over 6000 years would result in 20 to 79 mitochondrial genome-wide nucleotide differences. This prediction captured the average non-African mtDNA difference (38–40 nucleotides) quite well.2
However, after the paper was published, I was made aware that the upper end of this prediction (79 nucleotides) also barely captured the average African DNA difference (~77 nucleotides; average from Ingman et al. 2000). To reach this difference of 79 nucleotides, a constant rate of mutation and a generation time of 15 years had to be assumed. Since a 15 year generation time is at odds with typical practices today in the West, my initial thoughts were to continue to favor the prediction that I made previously—that Africans possess a faster mtDNA mutation rate—rather than favor the hypothesis of a historically very fast, African-specific generation time.
In this paper, I assess the relative merits of the fast generation time hypothesis versus the fast mutation rate hypothesis by examining marriage data from the United Nations (UN).
Materials and Methods
Procurement of Raw Marriage Data
Marriage data has been tracked by the UN Department of Economic and Social Affairs. Reported in terms of percentages of people married, the data from this department was downloaded from http://www.un.org/esa/population/publications/WMD2012/MainFrame.html during October, 2015, (United Nations 2013) by clicking on the “Table in EXCEL-Format” link near the top of the web page. The resulting table of data was manipulated in Microsoft Excel via the following steps:
- Using the “Filter” option in Excel, data for only “Men” or only “Women” were displayed, and only the “Married” data were displayed for either Men or Women.
- Then data from the columns containing the “Country”, “Year”, marriage age bin (e.g., “15–19”, “20–24”, etc.), and “Note on non-standard age groups” columns were copied to separate sheets.
- In the new sheets, the columns were sorted by year, smallest to largest, and then duplicates were removed based only on country. This effectively retrieved the earliest marriage data for each country, and the average UN assessment year by country was 1976 for both males and females (Supplemental Table 1).
- Alternatively, after step (2), columns in the new sheets were sorted by year, largest to smallest, and then duplicates were removed based on country. This effectively retrieved the most recent marriage data for each country. Some countries did not have marriage data from both early and late years, and duplicates of step (3) were removed for this step. (Hence, some rows were blank due to this deletion step.) For this dataset for both males and females, the average UN assessment year was 2005.
- Then the comments in the “Note on non-standard age groups” column were used to delete any data points that did not conform to the standard, explicitly stated age bins (e.g., standard bins= “15–19”, “20–24”, “25–29”, “30–34”, “35–39”, “40– 44”, “45–49”, “50–54”, “55–59, “60–64”, “65+”). (Hence, some entries contain blanks due to this deletion step.)
- From the datasets specific to each gender, the average and median marriage age percentages were calculated for each age bin (specified by the UN) and by each region (e.g., Africa, Caribbean, Eurasia, N. America, Pacific, S. America) or global subset (e.g., Africa, non-Africa) (see Supplemental Table 1 for details on groupings and calculations; Supplemental Table 1 also contains the embedded algorithms for calculating these statistics). Colored heat-mapping in Excel was used to highlight the range of results.
mtDNA Sequence Analysis
The NCBI accession numbers for raw sequence files from 371 human individuals of diverse ethnic origin (both African and non-African ethnic groups) were obtained in October, 2015, from the Human Mitochondrial Genome Database (http://www.mtdb.igp.uu.se/), a database maintained by the lead author of one of the seminal papers examining human mtDNA differences by ethnic group (Ingman et al. 2000) (see Supplemental Table 2). These sequences were aligned locally with CLUSTAL-MTV (http://www4a. biotec.or.th/GI/tools/clustalw-mtv), and the resultant alignment file was imported into BioEdit (http://www. mbio.ncsu.edu/bioedit/bioedit.html). Since sequences DQ112765 and DQ112749 appeared to be truncated as compared to the other 369 sequences, they were removed from further analysis. Then, as per the protocol in Jeanson (2015a), I replaced all non-standard nucleotides (e.g., N, M, R, Y, B, W, S, V, H, D) with gaps. I performed this step because I was interested only in clear mismatches. Then I stripped all columns containing gaps before creating a sequence difference count matrix. This matrix was imported into Microsoft Excel where the highest number of pair-wise DNA differences were identified (Supplemental Table 3).
Curated and stripped of its gaps, the CLUSTAL-MTV alignment file from above was imported into CLUSTALX 2.1 (http://www.clustal.org/clustal2/) where the “Draw Tree” option was used to create a Phylip format (.ph file) tree. I then used MEGA4 (http://www.megasoftware.net/mega4/mega.html) to visualize the resultant tree.
mtDNA Diversity Predictions
I predicted mtDNA diversity from both the evolutionary and YEC timescales, largely following the methods used previously (Jeanson 2015b). However, YEC model-specific considerations were incorporated into the present analyses; see Results section below for specifics.
Results
Global Generation Times
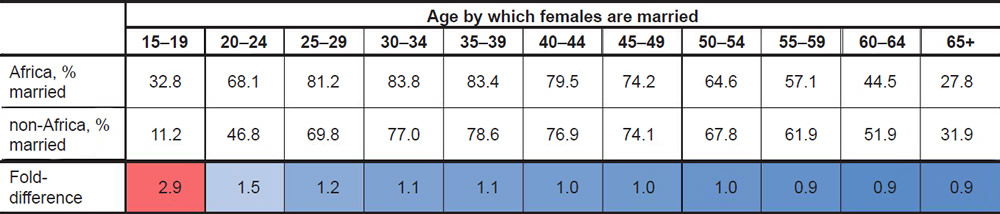
Calculation of the average marrying age by country revealed striking global patterns. In African nations surveyed around 1976, nearly a third (32.8%) of women were married by ages 15–19 (Table 1; difference was significant at p<0.05, see Supplemental Table 1). This percentage was nearly three times higher than the percentage among women from non-African nations, a difference which was specific to the 15–19 year-old age bin since the difference quickly disappeared with older age bins (Table 1). Later surveys still showed a similar fold-difference between African and non-African nations in the 15–19 year age bin (Supplemental Table 1), but the absolute values of the percentages decreased for both groups (Table 2), perhaps due to the increasing adoption of Western culture and practices in African nations. Though these data were based on calculating the average in the 1976 dataset, the trajectory of these findings were still true if the median rather than the average was used to calculate the percentages (Supplemental Table 1).
Table 1. Global marriag eages, 1976 data.
The marriage patterns among men were not as remarkable as the patterns among women. Though, on average in the 1976 dataset, African males did marry earlier at a higher rate than non-African males, the percentages for both groups in the 15–19 year age bin were so low that the difference in rate likely had a negligible effect on long-term generation time averages. This finding was true regardless of the year surveyed (Table 2; Supplemental Table 1).
Table 2. Comparison of marriage percentages in 15–19 year age bin.
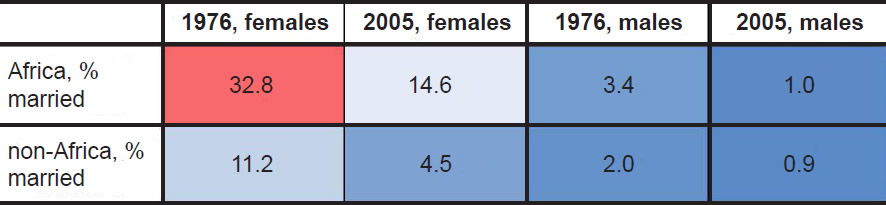
Together, these data suggested that African women married earlier on average than non-African women, and the fact that these differences appeared in the oldest UN dataset available suggests that this practice may have been true historically, well before Westernization took hold of the African continent.
Since mtDNA in humans is thought to be inherited primarily through the maternal lineage, this finding cast my previous mtDNA calculations in a new light.
Revised YEC predictions
Specifically, these results suggested that the overlap between my earlier predictions (Jeanson 2015b) and the average pairwise mtDNA difference in African groups was plausible.3 However, to explore whether these generation time data could explain the whole scope of mtDNA diversity, I realigned mtDNA sequences from even more individuals from a variety of ethnic groups to identify the maximum pairwise DNA difference. The resultant tree (Fig. 1; see also Supplemental Fig. 1 to zoom in on individuals within the tree) depicted results consistent with previous studies—the longest branch lengths belonged to African individuals.
However, the highest divergence (117 nucleotides) resulted from a comparison, not between two Africans, but between an African San individual and an Asian Taiwanese Aborigine (Table 3; see also Supplemental Table 3). From a biblical perspective, Africans and Asians probably split after the Flood, likely due to the events at the Tower of Babel. Going back to the time of the Flood, modern ethnic groups would have all traced their maternal ancestry back to the three wives of Noah’s sons (Jeanson 2015a). Consistent with this historical record, three major nodes were visible in human mtDNA trees (Fig. 1).4
Table 3. Top pairwise mtDNA differences.
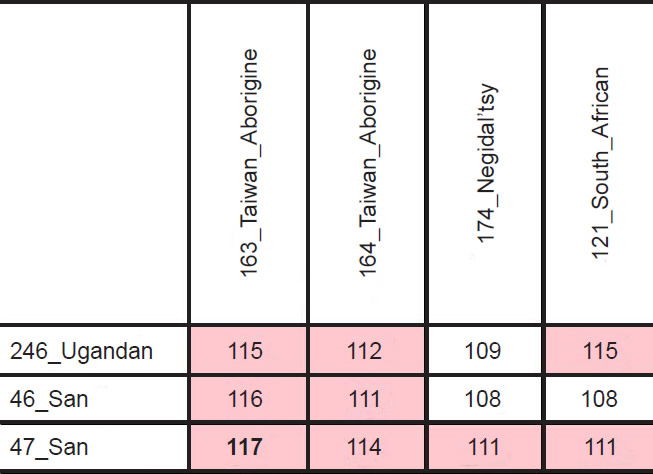
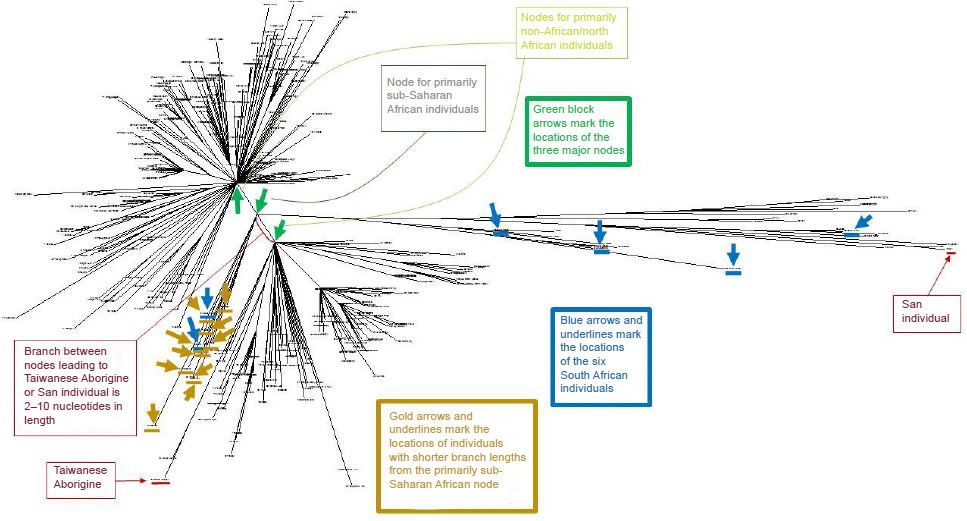
Fig. 1. Human mtDNA tree for 369 individuals of varying ethnicities. The 369 human mtDNA sequences clustered into three major nodes, which were indicated by green block arrows. One of the nodes spawned almost exclusively sub-Saharan African individuals, whereas the other two nodes gave rise predominantly to non-African and North African individuals (identities of individuals are more readily visible in Supplemental Fig. 1). The positions of the six South African individuals analyzed in Table 4 were indicated with blue block arrows and underlines. The positions of the individuals from the primarily African node with shorter branch lengths were indicated by gold arrows (two of the individuals were South African; hence the overlap). The most divergent pair of individuals was between the San and Taiwanese Aborigine individuals, denoted by the red block arrows and underlines.
In theory, among these three wives, Africans and Asians may have traced their ancestry back to different women. Consistent with this hypothesis, the highly divergent San and Taiwanese Aborigine individuals traced their ancestry back to different mtDNA nodes (Fig. 1). Thus, not only did the San and Taiwanese Aborigine not share a common ancestor after the Tower of Babel incident, they also appeared to have different maternal ancestors at the time of the Flood.
In light of these facts, I used a divergence calculation (differences=mutation rate*time*2) rather than a coalescence calculation (differences=mutation rate*time) to predict the maximum possible DNA differences arising in the time elapsed since the Flood. Multiplying 4365 years5by the upper end of the 95% confidence interval of the previously published (Jeanson 2015b) mtDNA mutation rate (e.g., 0.197 mutations per generation), and then converting the mutation rate to mutations per year,6 demonstrated that 115 nucleotide differences could have arisen since the Flood, assuming a generation time of 15 years (Supplemental Table 4).
This figure ignored the differences that arose pre-Flood among the lineages leading up to the 3 wives of Noah’s sons. Visual inspection of the mtDNA tree revealed a small branch connecting the respective nodes giving rise to the San individual and the Taiwanese Aborigine (Fig. 1). Using 4-way comparisons among several individuals in my dataset, I algebraically estimated that the connecting branch was about 2–8 nucleotides in length (calculation not shown).7 Though Genesis 5 indicates that ten paternal generations passed from Adam to Shem, more maternal generations might have passed from Eve to the Flood.8 Using a variety of generation times, a 6–22 nucleotide difference could easily have been produced in the ~1660 years from Creation to the Flood (Supplemental Table 4), which easily encompasses the 2–8 nucleotide pre-Flood branch length.
These conclusions were applicable beyond the specific individuals examined in our dataset. The highest number of pairwise mtDNA differences on record comes from a comparison of 7098 mtDNA genomes—Kim and Schuster (2013) reported a maximum mtDNA difference of 123. Adding the maximum number of predicted post-Flood mutations (e.g., 115) to the range of predicted pre-Flood mutations (e.g., 6–22) easily captured (e.g., total of 121–137 mutations) the 123 pairwise nucleotide difference (see Supplemental Table 4). Hence, the current rate of mtDNA mutation appeared sufficient to explain modern mtDNA differences among both African and non-African people groups.
One potential objection to these conclusions was the fact that my calculations for maximum divergence required an unending chain of generations in which the mother in each generation must have been born when her mother was 15 years old. Since women typically give birth to multiple children, a family of eight children might have had some born during the mother’s teen years and others born while the mother was in her twenties or thirties. My calculations implied that African women were the result of small families in which all children were born during the mother’s teen years, or that only the firstborn women (e.g., those born during a mother’s teen years) were the primary ancestors of modern African populations.
A careful reexamination of the statistics of the African groups softened this objection. As was visible in Fig. 1 (see also Supplemental Fig. 1), only some of the individuals tracing back to the primarily sub-Saharan African node had long branch lengths. About 10 of the 38 individuals branching off from the African node had branches roughly the same length as the individuals branching off from the non-African nodes (see the gold arrows and two of the blue arrows in Fig. 1; zooming in on specific individuals in Supplemental Fig. 1 permits identification of the ethnicities of the individuals noted by arrows). Furthermore, of the remaining 28 African individuals tracing back to the sub-Saharan African node, only a subset of them had branches as long as the extreme San individuals (identified as “46_San” and “47_San”).
As a specific illustration of this point, among the six South African individuals present in this dataset, all of them branched off from the primarily African node. This indicated that they were not individuals of European/non-African ancestry who just happened to recently migrate to South Africa. If they had recently migrated, they likely would have branched off one of the other two nodes. Instead, they all appeared to have a strictly African heritage, and their average pairwise mtDNA difference (i.e., each individual compared pairwise to each of the remaining 368 individuals) varied by a factor of two or more (Table 4; derived from raw data in Supplemental Table 3).
Table 4. Variation in average mtDNA differences in South African individuals.
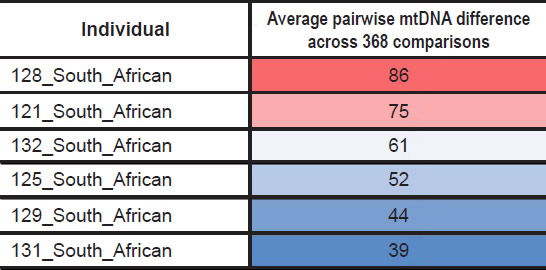
Thus, my conclusions that required an unending chain of 15-year-old mothers applied to only a subset of African lineages. Further investigation of the variation in pairwise differences among African groups should reveal how many generational chains will need to be invoked to explain the full scope of global mtDNA diversity.
YEC Versus Evolutionary Timescales
These findings suggested that the YEC and evolutionary timescales could be compared head-to-head, without any need to parse the data according to ethnicity as I did in a previous study (Jeanson 2015b). Multiplying a long generation time (35 years) by the slowest end of the 95% confidence interval for the mtDNA mutation rate (i.e., this represented a coalescence calculation, the calculation most generous to the evolutionary model) yielded the minimum number of mtDNA mutations that would have accumulated on the evolutionary timescale (see Supplemental Table 4 for details).
For the YEC model, the maximum number of predicted mtDNA differences (137) was derived from separately calculating pre-Flood and post-Flood mutations (Supplemental Table 4; see preceding section for derivation of details). To achieve a total of 137 differences, 22 pre-Flood mutations would have had to accumulate, a number seemingly at odds with the short branch lengths separating the three major nodes from one another (Fig. 1). However, since only eight nucleotides separated the maximum reported mtDNA difference today from the maximum predicted post-Flood mutations (115), I simply reported the maximum YEC predictions as 123.
Comparing this evolutionary prediction to these YEC predictions as well as to the maximum number of reported mtDNA differences (Kim and Schuster 2013) demonstrated that my earlier conclusions (Jeanson 2015b) still held true regardless of which ethnic groups were compared (Fig. 2). In short, the evolutionary model predicted a minimum number of differences nearly six times higher than the maximum number of mtDNA differences present today. By contrast, the YEC model exactly captured the full spectrum of mtDNA differences observable today (Fig. 2). These results demonstrated the scientific robustness of the YEC model and intensified the explanatory challenge for the evolutionary timescale.
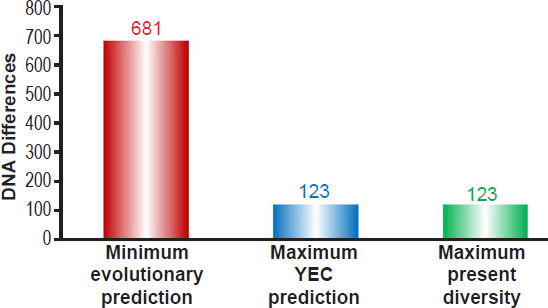
Fig. 2. Predictions of mtDNA diversity independent of ethnicity. Diversity in mitochondrial DNA (mtDNA) was predicted for the young-earth creation (YEC) timescale and the evolutionary timescale. The minimum mtDNA diversity predicted by the evolutionary timescale was represented by the height of the red bar, and the maximum mtDNA diversity predicted by the YEC timescale was represented by the height of the blue bar. Both predictions were compared to the maximum pairwise mtDNA difference in the published literature (green bar). As the image demonstrates, the YEC prediction clearly captured the maximum mtDNA diversity, but the evolutionary prediction far exceeded this number.
Discussion
The results of this study shed new light on the timing of the origin of human ethnic groups. My previous study (Jeanson 2015b) showed that non-African mtDNA diversity is easily explicable on the young-earth timescale, in a manner nearly independent of the generation time used. In other words, the predictions were successful under both short and long generation times. Furthermore, the statistical averages for the mutation rate (e.g., 0.158 mutations per generation) and generation times (e.g., a generation time of 25 years) exactly predicted the average genome-wide diversity in mtDNA.
However, these previous findings did not directly address the origin of African ethnic groups. The present study does, and it is consistent with the biblical history of the major ethnolinguistic groups. Sensitivity to the potential differences in generation times across major ethnolinguistic groups suggests that these groups arose simultaneously.
Nevertheless, these findings were limited by the fact that the UN data depicted ages by which women were married, rather than the ages at which they bore children. Furthermore, my conclusions were based on just two time points nearly 30 years apart, and these time points say nothing about the thousands of years of human history prior to the 1970s.
Despite these caveats, my results add preliminary support to population models that use 15 years as the generation time for African groups. Though 15 years is an early marriage age by current Western standards, these UN data demonstrate that such short generation times have a historical basis, and they legitimize the overlap between my previous predictions (Jeanson 2015b) and the average African pairwise diversity (Ingman et al. 2000). In short, the data in this current study demonstrate that the measured mtDNA mutation rate in non-Africans is sufficient to explain mtDNA diversity across all known modern ethnic groups, both non-African and African.
Whether these generation time differences are indeed the explanation remains to be seen. The observed generation time differences among ethnic groups in the last several decades (Table 1) may not have been the same throughout history. Furthermore, only when short generation times were combined with the higher end of the 95% confidence interval of the mutation rate, were high divergences predicted. Since the difference between the upper and lower bounds of the 95% confidence interval represent a ~1.7-fold difference, it is possible that Africans do indeed mutate their mtDNA at a faster rate than non-Africans.9 Hence, more precise measures of the mutation rate among various ethnic groups will be required to differentiate between the faster generation time hypothesis and the faster mutation rate hypothesis. Either way, the YEC model comprehensively explains all known modern mtDNA diversity.
Conversely, these generation time findings further challenge the evolutionary model of human origins, and they do so on two counts. First, the claim that long branch lengths in Africans indicates that Africans arose before non-Africans (Gomez, Hirbo, and Tishkoff 2014) implicitly assumes identical generation times across various ethnic groups. The fact that striking differences are still observable today calls into question the plausibility of this assumption.
Though evolutionists will likely dismiss the data in the current study as a modern anecdote and as irrelevant to populations living hundreds of thousands of years ago, these data represent a documented example of non-equivalent generation times in various ethnic groups—groups which just happen to be at the forefront of the out-of-Africa debate. At a minimum, these data should force the evolutionists to acknowledge that their conclusions about the relative timing of the various people groups stand only under the assumptions of equivalent generation times across ethnic groups.
Second, extending my earlier results (Jeanson 2015b) across all ethnic groups, the evolutionary model still predicts human mtDNA differences far in excess of the actual number (Fig. 2). Since the archaeological and paleontological basis for the evolutionary model relies on the assumption of constant rates of change in geological and geophysical processes (e.g., carbon-14 dating), and since these genetic predictions also assumed constant rates of change, the evolutionary model faces a serious scientific conundrum.
If evolutionists invoke slower rates of genetic change to explain the current data, this undermines the foundational assumption of their geologic models. If, instead, evolutionists invoke natural selection, this post hoc explanation will need to be transformed into a testable, predictive model before it can be considered scientific. Regardless of which option the evolutionists choose, the prospects of scientific coherence do not appear favorable.
Conclusion
Differential generation time data and a constant rate of mtDNA mutation are sufficient to explain human mtDNA diversity on the YEC timescale across all ethnic groups. These results potentially unify the YEC model of human genetic origins, and they intensify the explanatory challenge for the evolutionary model.
Acknowledgments
Discussions with Rob Carter have been invaluable in understanding the relevant population genetic equations and predictions for the origin of modern human genetic diversity. Thanks also to Steve Hopper of the Institute for Creation Research who previously provided assistance on Poisson statistics.
References
Gomez, F., J. Hirbo, and S.A. Tishkoff. 2014. “Genetic Variation and Adaptation in Africa: Implications for Human Evolution and Disease.” Cold Spring Harbor Perspectives in Biology 6 (7): a008524.
Hardy, C., and R. Carter. 2014. “The Biblical Minimum and Maximum Age of the Earth.” Journal of Creation 28 (2): 89–96.
Hinch, A.G., A. Tandon, N. Patterson, Y. Song, N. Rohland, C.D. Palmer, G.K. Chen, et al. 2011. “The Landscape of Recombination in African Americans.” Nature 476 (7359): 170–175.
Ingman, M., H. Kaessmann, S. Pääbo, and U. Gyllensten. 2000. “Mitochondrial Genome Variation and the Origin of Modern Humans.” Nature 408 (6813): 708–713.
Jeanson, N.T. 2013. “Recent, Functionally Diverse Origin for Mitochondrial Genes from ~2700 Metazoan Species.” Answers Research Journal 6: 467–501.
Jeanson, N.T. 2015a. “Mitochondrial DNA Clocks Imply Linear Speciation Rates Within ‘Kinds’.” Answers Research Journal 8: 273–304.
Jeanson, N.T. 2015b. “A Young-Earth Creation Human Mitochondrial DNA ‘Clock’: Whole Mitochondrial Genome Mutation Rate Confirms D-Loop Results.” Answers Research Journal 8: 375–378.
Kim, H.L., and S.C. Schuster. 2013. “Poor Man’s 1000 Genome Project: Recent Human Population Expansion Confounds the Detection of Disease Alleles in 7,098 Complete Mitochondrial Genomes.” Frontiers in Genetics 4: 1–13.
United Nations, Department of Economic and Social Affairs, Population Division. 2013. World Marriage Data 2012 (POP/DB/Marr/Rev2012).
Supplemental Files
Supplemental Fig. 1. PDF version of mtDNA tree for Fig. 1, in order to make zooming in on individual names easier.
Supplemental Table 1. Summary of United Nations marriage data by gender and year.
Supplemental Table 2. Identifiers and NCBI accession numbers for sequences aligned in this study.
Supplemental Table 3. Pairwise single nucleotide polymorphism sequence differences among 369 individuals of diverse ethnicities.
Supplemental Table 4. Predictions of mtDNA differences under the YEC and evolutionary models.