
Research conducted by Answers in Genesis staff scientists or sponsored by Answers in Genesis is funded solely by supporters’ donations.
Abstract
Previous studies of the human mitochondrial DNA mutation rate suggested the existence of a molecular “clock” that measured time consistent with the young-earth timescale, but these studies were limited to the D-loop (~7% of the mitochondrial DNA genome). Several recent studies measured the mutation rate in the entire mitochondrial DNA genome. I demonstrate that these new data agree with the expectations from D-loop results, further confirming the origin of the human race within the last 6000 years and strongly rejecting the evolutionary and old-earth creation timescales.
Keywords: molecular clock, mitochondrial DNA, human population genetics, young-earth creation, mutation rate, D-loop, genome
Introduction
The evolutionary molecular “clock” has a long and troubled history (Tomkins and Bergman 2015). Hampered by a lack of empirically-measured mutation rates, the evolutionary molecular clock researchers have historically assumed mutation rates by dividing two species’ genetic differences by their evolutionary time of divergence (e.g., human-chimpanzee divergence in Ingman et al. 2000). Since the latter was inferred from the evolutionary age assignments in the fossil record, the evolutionary molecular “clock” amounted to a circle of evolutionary assumptions and never an independent test of a species’ time of origin.
The advent of modern molecular genetics has resulted in an increasing number of publications in which mutation rates in various species and in various genetic compartments (e.g., nucleus, mitochondria) have been empirically determined, independent of the evolutionary age assignments in the fossil record. Using the mitochondrial mutation rates, predictions can be made on how much mitochondrial DNA (mtDNA) diversity should result after a specific number of years have elapsed. Comparing the predictions of the young-earth timescale to the evolutionary timescale revealed that mutations happen far too quickly for the evolutionary timescale to be true but exactly as predicted under the young-earth model (Jeanson 2013, 2015).
Two factors limited the scope of the previous investigations of the human mitochondrial DNA clock. First, a statistically-reliable mutation rate had been measured only for a subset of the mitochondrial genome sequence, the D-loop, which represents only ~7% of the 16,569 base-pairs in the mitochondrial genome (Jeanson 2013, 2015). Second, the rate had been measured only in non-Africans.
Several additional reports have appeared (Ding et al. 2015; Guo et al. 2013; Rebolledo-Jaramillo et al. 2014) since Jeanson’s retrodictions were published, and all three of these new reports measured the mutation rate in the entire mtDNA sequence.
In this study, I revisited the question of the empirically-derived human mtDNA clock with these new data.
Materials and Methods
Procurement of raw data
The whole genome mtDNA mutation rates were calculated from the raw data in the published literature (Ding et al. 2015; Guo et al. 2013; Rebolledo-Jaramillo et al. 2014). Because multiple copies of the mtDNA genome exist in each cell, mutations can occur in one of the copies without affecting or spreading to the other copies, creating a state termed “heteroplasmy”. Since the fate of these heteroplasmic mutations is not entirely understood (i.e., it’s not clear how frequently these mutations are lost or how frequently they become the dominant copy in the cell), I used the mutation rate in each study derived only from the scoring of those mutations that were present among all copies of the mtDNA genome (e.g., “homoplasmic” mutations). Effectively, I took a conservative approach towards scoring mtDNA mutations in order to be generous towards the evolutionary model.
In the Guo et al. (2013) study, the authors clearly stated that no homoplasmic mutations were found in the 26 mother-child pedigrees that were examined. Due to the uncertainties surrounding the eventual cellular fate of heteroplasmic mutations, and to be overly generous to the evolutionary model (see results below), I treated heteroplasmic mutations as non-mutations.
In the Rebolledo-Jaramillo et al. (2014) study, it is unclear whether homoplasmic mutations were even scored in the 39 mother-child pedigrees that were examined. Since none were reported, I assumed that none occurred, and, to be overly generous to the evolutionary model (see results below) I treated the heteroplasmic mutations as non-mutations.
In the Ding et al. (2015) study, the authors examined an order of magnitude more pedigrees than either of the two studies above and scored both heteroplasmic and homoplasmic mutations. Again, I ignored all mutations reported as heteroplasmic. Conversely, the identified homoplasmies were so rare that the authors treated them as essentially inconsequential. Nevertheless, they did sequence the mtDNA of 333 parent-child relationships, and in Table 1 of their paper, they report 7273 homoplasmic variants in the children, of which 7238 were shared with the mother. Thus, 35 (7273–7238) new homoplasmic mutations appeared in the offspring.
| Study | Pedigrees Examined | Base Pairs per Pedigree Examined | Total Base Pairs Examined | Number of Homoplasmic Mutants Detected | Ethnicity of Pedigrees |
|---|---|---|---|---|---|
| Guo et al. (2013) | 26 | 16,569 | 430,794 | 0 | Danish, Finnish |
| Rebolledo-Jaramillo et al. (2014) | 39 | 16,569 | 646,191 | 0 | European |
| Ding et al. (2015) | 333 | 16,569 | 5,517,477 | 63 | Sardinian |
| TOTAL | 398 | 6,594,462 | 63 | ||
| Mutation rate (per base pair per generation) | 9.55E-06 | ||||
| Mutation rate (per mtDNA genome per generation) | 1.58E-01 | ||||
| 95% Confidence interval (upper) | 1.97E-01 | ||||
| 95% Confidence interval (lower) | 1.19E-01 |
They also reported 7266 homoplasmic variants in the mother of which only 7238 were shared with the child. Since “variants” were scored in both the mother and the child via comparison of the sequence in question to a standard reference sequence, an additional 28 (7266–7238) variants in the mother appear to have been mutated to a different state in the child.
Together, these variants amount to a total of 63 (35 + 28) mutations between parents and offspring. Since these 63 variants represented less than 1% of the total variants in the mothers or children, it is not surprising that the authors treated them as inconsequential. However, as demonstrated below, they represented a very significant finding.
To reiterate, these three studies differed dramatically in their statistical power. The Ding et al. (2015) study examined far more pedigrees than the Guo et al. (2013) and Rebolledo-Jaramillo et al. (2014) studies combined (table 1). Since the mutation rate in humans is less than one mutation per generation as (per calculations below table 1), poorly powered statistical studies can easily miss mutations due to the rareness of a mutational event. Nevertheless, to be fair to the evolutionists, I included all three studies in my calculations, but I weighed the results of each based on the total number of base pairs examined in each study, which is a function of the number of pedigrees examined (see table 1 for details of the math and weighing).
Calculation of whole mtDNA genome mutation rate
The pooled data from these three studies were used to calculate a mtDNA mutation rate. Since the Ding et al. (2015) study examined the most pedigrees, it was given the most weight in the pooling of the raw data. Interestingly, the resultant rate was virtually identical to the calculated mutation rate for the D-loop based on pooled and statistically weighted data (table 1; compare to table 4 of Jeanson 2013). Since mutations were rare events, I assumed that they followed a Poisson distribution and calculated a 95% confidence interval as appropriate (table 1).

Results
Using the standard coalescence equation for mtDNA (e.g., mtDNA base pair differences = mutation rate * time to common ancestor; after Futuyma 2013), I predicted mtDNA diversity over 6000 years and over 50,000 years (see supplemental table 1 for details). The former length of time represents the most likely time of divergence for the human mtDNA lineages, based both on textual considerations (Hardy and Carter 2014) and on the structure of the human mtDNA family tree (Jeanson 2015). The 50,000 year length of time represents the postulated evolutionary time of origin for non-African people groups (Poznik et al. 2013) (note that I erroneously used the postulated time of origin for the African people groups in a previous study [Jeanson 2013]).
I compared these predictions to the best estimates of the mtDNA diversity among non-African people groups (Ingman et al. 2000; Kim and Schuster 2013). As Fig. 1 demonstrates, the predictions for the young-earth timescale (20 to 79 base pair differences after 6000 years) perfectly captured existing mtDNA diversity (38 to 40 base pair differences) while the predictions for the evolutionary timescale were nearly an order of magnitude off (170 to 658 base pair differences after 50,000 years). These results confirmed the previous studies on the D-loop (Jeanson 2013, 2015).
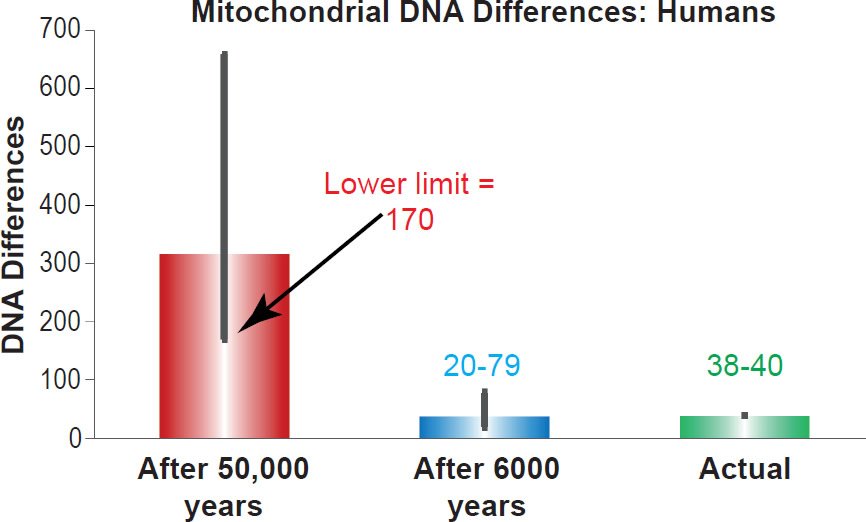
Fig. 1. Confirmation of the human mitochondrial DNA clock. Predictions of whole genome mitochondrial DNA diversity in humans were made for the young-earth creation and evolutionary/old-earth timescales using the mutation rate derived in Table 1. These predictions were compared to the average mitochondrial DNA difference among non-Africans. Height of each colored bar represented the average difference (all three columns), and the thick black bars represented the 95% confidence interval (red and blue bars) or the range (green bar).
Discussion
This study represents an important and significant step forward in our understanding of the origin of human mtDNA differences. Though the mutation rate was measured only in European individuals, predictions with this mutation rate on the 6000 year timescale captured the mtDNA diversity in all non- African people groups, including the major Eurasian groups and the representatives of the native peoples of the Americas (fig. 1). Furthermore, predictions with this mutation rate on the evolutionary timescale strongly rejected the evolutionary model (fig. 1).
These results had ramifications beyond molecular genetics. To support their contention of millions of years of species’ history, evolutionists use geologic methods that rely on the assumption of constant rates of change (e.g., see http://biologos.org/blog/how-do-we-know-the-earth-is-old-infographic and Vardiman, Snelling, and Chaffin 2005). Applying this same assumption to genetics obviously contradicts this timescale and strongly confirms the biblical timescale (fig. 1; see also Jeanson 2013, 2015). Without the assumption of constant rates of change in geology, the basis of the evolutionary arguments for millions of years disappear. Thus, the results of this study put the evolutionary timescale in a difficult position, one that is becoming increasingly harder to defend in a scientifically coherent manner.
Conversely, since certain African groups are more genetically diverse than non-African groups (Ingman et al. 2000), it remains to be seen whether the results in this study will hold true in the African groups as well. Two major hypotheses exist for the increased mtDNA diversity in Africans. Either they originated first, or they mutate their mtDNA slightly faster than non-Africans.
The evolutionary out-of-African model naturally holds to the first explanation, but the results of this study already undermine this hypothesis. The most diverse humans in the mtDNA databases are 123 base pairs apart (Kim and Schuster 2013), yet after just 50,000 years of mutation, non-African humans would have been at least 170 base pairs different (fig. 1 and supplemental table 1). Had we used the evolutionary date for the origin of African people groups (e.g., ~180,000 years), the predicted amount of mutational differences would have been even higher than 170 base pairs. Hence, the evolutionary model needs slower mutation rates overall, not just in non-African people groups.
Scripturally, all ethnic groups likely find their ultimate origin at the tower of Babel event (Genesis 11). Genetically, the structure of the human mtDNA tree reflects this event (Jeanson 2015), implying that non-African and African groups originated at the same time in history. Based on the successful results of this study, I predict that the most diverse African groups will be found to mutate their mtDNA at a rate ~2-fold faster than reported here (e.g., at 0.2 to 0.3 mutations per genome per generation rather than 0.16 mutations per genome per generation).
Conversely, the results of this study demonstrate that the current rate of mtDNA mutation in non- Africans is predictable from the young-earth timescale and from mtDNA diversity among extant humans. This underscores the previous contention that DNA sequences from fossils are too degraded to be useful for comparative DNA analyses today (Criswell 2009; Jeanson 2015; Thomas and Tomkins 2014).
The only remaining caveat to the present results is whether the mutation rate reported in Ding et al. (2015) represents a germline rate rather than a somatic mutation rate. To confirm germline transmission in the future, the DNA sequences from at least three successive generations must be sequenced to demonstrate that variants were not artifacts of mutation accumulation in non-gonadal cells.
Conclusion
The brief results presented here strengthen the evidence for the existence of a molecular “clock” that “ticks” in a manner consistent with the young-earth timescale, bringing the total number of species with whole mtDNA genome predictions to four (see Jeanson 2013, 2015 for the other three species). This body of evidence from diverse life forms strongly contradicts the evolutionary and old-earth creation timescales and make the scientific coherence of these latter models all the more implausible. This new line of mitochondrial DNA evidence adds to the ever increasing bulk of genetic data that supports a young-earth timescale in accord with the historical record of Scripture (see recent review by Tomkins 2015).
Acknowledgments
Discussions with Rob Carter have been extremely helpful in understanding the relevant population genetic equations and predictions for the origin of modern human genetic diversity. Thanks also to Steve Hopper of the Institute for Creation Research who previously provided statistical assistance. Additional thanks to the reviewers whose comments helped refine and strengthen this paper.
References
Criswell, D. 2009. “Neandertal DNA and Modern Humans.” Creation Research Society 45: 246–54.
Ding, J., C. Sidore, T. J. Butler, M. K. Wing, Y. Qian, O. Meirelles, F. Busonero, et al. 2015. “Assessing Mitochondrial DNA Variation and Copy Number in Lymphocytes of ~2,000 Sardinians Using Tailored Sequencing Analysis Tools.” PLoS Genetics 11(7):e1005306. doi: 10.1371/journal. pgen.1005306.
Futuyma, D. J. 2013. Evolution. Sunderland, Massachusetts: Sinauer Associates, Inc.
Guo, Y., C.-I. Li, Q. Sheng, J. F. Winther, Q. Cai, J. D. Boice, and Yu Shyr. 2013. “Very Low-Level Heteroplasmy mtDNA Variations are Inherited in Humans.” Journal of Genetics and Genomics 40 (12): 607–15. doi:10.1016/j. jgg.2013.10.003.
Hardy, C., and R. Carter, R. 2014. “The Biblical Minimum and Maximum Age of the Earth.” Journal of Creation 28 (2): 89–96.
Ingman, M. H. Kaessmann, S. Pääbo, and U. Gyllensten. 2000. “Mitochondrial Genome Variation and the Origin of Modern Humans.” Nature 408 (6813): 708–13.
Jeanson, N. T. 2013. “Recent, Functionally Diverse Origin for Mitochondrial Genes From ~2700 Metazoan Species.” Answers Research Journal 6: 467–501. https://answersingenesis.org/genetics/mitochondrial-dna/recent-functionally-diverse-origin-for-mitochondrial-genes-from-~2700-metazoan-species/.
Jeanson, N. T. 2015. “Mitochondrial DNA Clocks Imply Linear Speciation Rates Within “Kinds.” Answers Research Journal 8: 273–304. https://answersingenesis.org/natural-selection/speciation/clocks-imply-linear-speciation-rates-within-kinds/.
Kim, H. L., and S. C. Schuster. 2013. “Poor Man’s 1000 Genome Project: Recent Human Population Expansion Confounds the Detection of Disease Alleles in 7,098 Complete Mitochondrial Genomes.” Frontiers in Genetics 4: 1–13. doi: 10.3389/fgene.2013.00013.
Poznik, G. D. , B. M. Henn, M-C. Yee, E. Sliwerska, G. M. Euskirchen, A. A. Lin, M. Snyder, L. Quintana-Murci, J. M. Kidd, P. A. Underhill, and C. D. Bustamante. 2013. “Sequencing Y Chromosomes Resolves Discrepancy in Time to Common Ancestor of Males Versus Females.” Science 341 (6145): 562–65. doi: 10.1126/science.1237619.
Rebolledo-Jaramillo, B., M. S-W. Su, N. Stoler, J. A. McElhoe, B. Dickins, D. Blankenberg, T. S. Korneliussen, et al. 2014. “Maternal Age Effect and Severe Germ-Line Bottleneck in the Inheritance of Human Mitochondrial DNA.” Proceedings of the National Academy of Sciences USA 111 (43): 15474–79. doi: 10.1073/pnas.1409328111.
Thomas, B., and J. Tomkins. 2014. “How Reliable are Genomes From Ancient DNA?” Journal of Creation 28 (3): 92–98.
Tomkins, J. P. 2015. “Empirical Genetic Clocks Give Biblical Timelines.” Journal of Creation 29 (2): 3–5.
Tomkins, J. P., and J. Bergman, J. 2015. “Evolutionary Molecular Genetic Clocks—A Perpetual Exercise in Futility and Failure.” Journal of Creation 29 (2): 26–35.
Vardiman, L., A. A. Snelling, and E. F. Chaffin. eds. 2005. Radioisotopes and the Age of the Earth: Results of a Young- Earth Research Initiative. Vol. 2. El Cajon, California: Institute for Creation Research and Chino Valley, Arizona: Creation Research Society.
Supplemental XLS File
Supplemental Table 1. Raw calculations for predictions of mitochondrial DNA diversity will download when link is clicked.