The views expressed in this paper are those of the writer(s) and are not necessarily those of the ARJ Editor or Answers in Genesis.
Abstract
Precipitation from three winter storms during December, 2005; November, 2006; and October, 2008 in Yellowstone National Park was simulated with the National Center for Atmospheric Research (NCAR) mesoscale weather model called WRF (Weather Research and Forecasting model). The sea-surface temperature of the Pacific Ocean upwind of the western United States was prescribed with six different fixed temperatures and the resulting simulated precipitation compared to the actual storm precipitation. Sea-surface temperatures over 30°C (86°F) increased the precipitation above normal by as much as a factor of four. Based on the likely four-fold increase in precipitation rate and doubling of the frequency of storms following the Genesis Flood, glaciers over a kilometer (3,300 ft.) thick would have developed in a few hundred years.
Keywords: Precipitation, Yellowstone National Park, winter storms, zonal flow, Gulf of Alaska Low, plunging low, Mesoscale Meteorology Model, Weather Research and Forecasting Model, WRF, NCAR, sea-surface temperature, SST, glaciers, Genesis Flood
Introduction
Vardiman (2008) proposed that a series of numerical simulations of precipitation be conducted in Yosemite and Yellowstone National Parks to determine if a warm northwest Pacific Ocean heated by the Genesis Flood could explain the occurrence of glaciers for the Sierra Nevada and the Rocky Mountains in a young-earth time frame. He suggested that a conventional mesoscale meteorology model available from the National Center for Atmospheric Research (NCAR) be used to simulate precipitation for several types of storms at multiple sea-surface temperatures (SSTs). The first simulation to be completed was a warm storm in Yosemite National Park with a long, steady fetch over the Pacific Ocean from near Hawaii called the Pineapple Express (PEX). Vardiman and Brewer (2010a) reported that warm sea-surface temperatures in the Pacific Ocean for this warm storm would have increased the precipitation rate by as much as a factor of four and likely contributed to massive glacial growth in Yosemite National Park. Vardiman and Brewer (2010b) also reported on two additional case studies in Yosemite National Park—A Deep Upper Low case and a Rex Block Pattern case. They were examples of other types of cold, winter orographic storms which migrate across the Pacific Ocean into California from the west or the northwest. The Rex Block Pattern case didn’t appear to make a significant contribution to the climatological accumulation of glaciers in Yosemite National Park. However, the simulation of the Deep Upper Low case indicated that this type of storm was a major contributor to enhanced glaciers during the ice age. In fact, due primarily to this storm type alone glaciers during the ice age would have accumulated at a rate six times that of today and would have led to glaciers thousands of feet thick in a century or so.
The simulation of glacial growth in Yosemite National Park under a warm Pacific Ocean from the previous studies characterized likely ice age conditions along the coastal mountain ranges and the Sierra Nevada of the southwestern United States. A question remains about glacier growth farther north and inland. To address this question, simulations were conducted in this study for three types of winter storms which affect Yellowstone National Park. It is well known that during the ice age glaciers filled the Yellowstone Lake basin several thousand feet thick and covered other high peaks in and around Yellowstone National Park (Pierce 1979). How would warmer sea-surface temperatures in the Pacific Ocean over 1,000 km (625 miles) to the west affect glaciers in Yellowstone National Park?
General Storm Summaries
Continuous Zonal Flow (CZF) storms
(December 26, 2005–January 5, 2006)
The CZF storms were a series of four short waves which traveled from west to east across the central and northern tier of states following Christmas of 2005. A short wave is a horizontal oscillation in the jet stream which flows at mid-latitudes between about 4.5–9.0 km (15–30,000 ft) in altitude. Short waves typically have horizontal wave lengths of less than about 1,000 km (600 mi) and produces fast moving storms at the earth’s surface. This is in contrast to long waves which have horizontal wave lengths of about 6,000 km (3,600 mi) and generally move relatively slowly. The type of storms which produce the majority of precipitation in Yellowstone National Park and surroundings are generally short waves. Although they don’t individually produce a large amount of precipitation, such storms occur so frequently that the seasonal accumulation is substantial.
Figs. 1–10 illustrate the general atmospheric flow at the 500-mb pressure level which occurs at about 5.5 km (~18,000 ft) above sea level over Yellowstone National Park. Note the semi-permanent low-pressure trough in the Gulf of Alaska and off the northeastern coast of the United States. A semi-permanent high-pressure ridge occurred in the central United States. During the ten-day period of this case study four upper-level short waves moved rapidly through the ridge and across Yellowstone National Park in northwest Wyoming and adjacent southwest Montana. It took approximately four days for the short waves to move across the United States at a rate of about 1000 km/day (25 mph). The temperature at the 500-mb level averaged about −25°C (−13°F) in each storm and the winds at the same level averaged about 35 knots (40 mph).
Each short wave aloft has a surface low associated with it. Figs. 11–20 illustrate the United States surface weather maps for the 10-day CZF storm period with temperature, dew point, pressure, pressure change, and wind speed and direction shown for selected stations. In addition, isobars in solid, red lines; isotherms in dashed, blue lines; high pressure centers; low pressure centers; fronts; and precipitation areas in green are shown on the maps. As the short waves moved from the Pacific Ocean onto the North American continent, high-pressure areas preceded and followed the surface front. As the fronts crossed into the intermountain region of the western United States, high pressure was displaced with low pressure, but, generally, the fronts and low-pressure centers were disorganized by the mountainous terrain and very difficult to visualize. Only when the fronts exited the mountains onto the Great Plains did the low-pressure centers and fronts become clearly evident.
In Yellowstone National Park, it was difficult to determine when a front passed through. The best indication of a frontal passage was the change from decreasing surface pressure to increasing pressure, a change from a southerly wind component to a northerly wind component, and a decrease in temperature. The wind fields were also distorted by the mountainous terrain, so that the change in wind direction was not always a good indicator of frontal passage. Dew points and cloud cover are seldom helpful in detecting a frontal passage in the mountains. It is easier to visualize the movement of the short waves on the 500-mb charts, but more difficult to see their reflection at the surface. For example, the first short wave in the CZF storm series crossed from the Pacific Ocean onto the North American continent at 12Z on Monday, December 26. By 12Z on Tuesday, December 27 it was located over the Colorado/Kansas state line, over the Mississippi River by 12Z on Wednesday, December 28, over western North and South Carolina on Thursday, December 29, and over Maine on Friday, December 30.
The surface fronts associated with developing short waves are typically several hundred miles ahead of the trough aloft. The frontal position of the first short wave at 12Z on Monday, December 26, was in the intermountain region and almost impossible to locate because of the strong high-pressure ridge. However, at 12Z on Tuesday, December 27, a low-pressure center formed over central Kansas a couple hundred miles ahead of the trough aloft as it exited the mountains. The low-pressure center developed a cold front trailing southward through Oklahoma and Texas and a warm front moving into eastern Oklahoma and Arkansas. The surface low and frontal system began to deepen and become better organized as it moved eastward across the United States and off the east coast. Each of the other three short waves had similar patterns.
As short waves approach the West Coast they tend to develop an organized precipitation field ahead of the front. But, because the short waves are disrupted by the mountains, the precipitation fields become spotty and poorly organized. For example, the second short wave which approached the West Coast at 12Z on Wednesday, December 28, produced a large precipitation field shown as the green area on the surface chart for Wednesday, December 28, from south of San Francisco to north of Seattle and inland as far as Nevada and Idaho. Yet, while the trough was in the intermountain region at 12Z on Thursday, December 29, the precipitation field was much smaller and limited to central Montana. After the surface front moved onto the northern plains at 12Z on Friday, December 30, the precipitation field enlarged again to cover eastern North and South Dakota, Minnesota, and Michigan. As the trough continued eastward on Saturday, December 31, the precipitation field maintained similar coverage over the Great Lakes.

Fig. 1. 500-mb chart at 12Z on Monday, December 26, 2005.

Fig. 2. 500-mb chart at 12Z on Tuesday, December 27, 2005.

Fig. 3. 500-mb chart at 12Z on Wednesday, December 28, 2005.

Fig. 4. 500-mb chart at 12Z on Thursday, December 29, 2005.

Fig. 5. 500-mb chart at 12Z on Friday, December 30, 2005.

Fig. 6. 500-mb chart at 12Z on Saturday, December 31, 2005.

Fig. 7. 500-mb chart at 12Z on Sunday, January 1, 2006.

Fig. 8. 500-mb chart at 12Z on Monday, January 2, 2006.

Fig. 9. 500-mb chart at 12Z on Tuesday, January 3, 2006.

Fig. 10. 500-mb chart at 12Z on Wednesday, January 4, 2006.

Fig. 11. Surface chart at 12Z on Monday, December 26, 2005.

Fig. 12. Surface chart at 12Z on Tuesday, December 27, 2005.

Fig. 13. Surface chart at 12Z on Wednesday, December 28, 2005.

Fig. 14. Surface chart at 12Z on Thursday, December 29, 2005.

Fig. 15. Surface chart at 12Z on Friday, December 30, 2005.

Fig. 16. Surface chart at 12Z on Saturday, December 31, 2005.

Fig. 17. Surface chart at 12Z on Sunday, January 1, 2006.

Fig. 18. Surface chart at 12Z on Monday, January 2, 2006.

Fig. 19. Surface chart at 12Z on Tuesday, January 3, 2006.

Fig. 20. Surface chart at 12Z on Wednesday, January 4, 2006.
Gulf of Alaska Low (GAL) storms
(November 8–16, 2006)
The GAL storms were a series of three short waves which traveled from northwest to southeast across the United States prior to Thanksgiving of 2006. This is the second most common type of storm which produces precipitation in Yellowstone National Park and surroundings. This type of storm is similar to the CZF type except the storm track is through the Gulf of Alaska over colder water slanting southeastward across the continental United States. The high-pressure ridge in the central United States is also not as strong as that for the CZF storms. Although these storms don’t individually produce a large amount of precipitation, they occur frequently and contribute strongly to the seasonal accumulation.
Figs. 21–28 illustrate the general atmospheric flow at the 500-mb pressure level. Note the strong semi-permanent low-pressure trough in the Gulf of Alaska. In this type of storm the trough off the northeastern coast of the United States is farther east and north of Newfoundland. A weak semi-permanent high-pressure ridge occurs in the central United States. During the eight-day period of this case study three upper level short waves moved through the ridge and across Yellowstone National Park. It took approximately five days for the short waves to move across the United States at a rate of about 800 km/day (20 mph). The temperature at the 500-mb level averaged about –30°C (–22°F) in each storm and the maximum winds at the 500-mb level averaged about 90 km/hour (50 knots, 57 mph).
Figs. 28–36 illustrate the United States surface weather maps for the 8-day GAL storm period with the same meteorological elements as for the CZF case. As the short waves moved from the Gulf of Alaska onto the North American continent the upper-level trough depressed the high pressure in the central United States. The fronts entering the northwest coast became more disorganized by the mountainous terrain, but were easier to track across the intermountain west than the CZF case. As the fronts exited the mountains onto the Great Plains the low-pressure centers and fronts again became more organized. In Yellowstone National Park, it was still difficult to determine when a front passed through, and the best indication of a frontal passage was again the change from decreasing surface pressure to increasing pressure, a change from a southerly wind component to a northerly wind component, and a decrease in temperature. The first short wave in the GAL storm series crossed from the Pacific Ocean onto the North American continent between 12Z on Wednesday, November 8, and 12Z Thursday, November 9. By 12Z on Friday, November 10, it was located over central Colorado, over Missouri by 12Z on Saturday, November 11, over North Carolina on Sunday, November 12, off the coast of Virginia on Monday, November 13, and near Boston on Tuesday, November 14.

Fig. 21. 500-mb chart at 12Z on Wednesday, November 8, 2006.

Fig. 22. 500-mb chart at 12Z on Thursday, November 9, 2006.

Fig. 23. 500-mb chart at 12Z on Friday, November 10, 2006.

Fig. 24. 500-mb chart at 12Z on Saturday, November 11, 2006.

Fig. 25. 500-mb chart at 12Z on Sunday, November 12, 2006.

Fig. 26. 500-mb chart at 12Z on Monday, November 13, 2006.

Fig. 27. 500-mb chart at 12Z on Tuesday, November 14, 2006.

Fig. 28. 500-mb chart at 12Z on Wednesday, November 15, 2006.
The surface frontal position of the first short wave at 12Z on Thursday, November 9, was in the intermountain region and very difficult to locate because of the prevailing high-pressure ridge. However, at 12Z on Friday, November 10, a low-pressure center formed over central Oklahoma as it exited the mountains. The low-pressure center developed a cold front trailing southward through Texas and westward into New Mexico and a warm front northward over Missouri and Illinois. The surface low and frontal system then began to deepen and moved north and eastward. The other two short waves developed more easily recognizable low-pressure centers in the intermountain region before moving southeastward and up the east coast as they left the mountains.
The precipitation fields from the GAL short waves were extremely spotty as they moved through the intermountain region. Notice that only after the troughs left the mountains and began to get organized in the central United States and along the east coast did the precipitation shield cover any sizable area. The main reason for this spottiness over the western United States is the lack of moisture the short waves were able to pick up from the cold Gulf of Alaska. Even in the central United States they had not been able to tap into any source of moisture. Once the short waves formed surface low-pressure centers in the southeast near the Gulf of Mexico or along the east coast near the Atlantic Ocean they were able to ingest moisture from these sources and produce more precipitation. Note how the third short wave dropped southeastward and formed a surface low-pressure center over Arkansas. It formed a precipitation shield in eastern Louisiana and over Arkansas; southern Missouri, Illinois, and Indiana; northern Alabama, Mississippi, and Georgia; Kentucky; and Tennessee.
The intermountain region is typically limited to relatively dry storms and light precipitation unless the trajectory of the flow is from the southwest. Even then the coastal mountains tend to wring out much of the moisture before the storm reaches places like Yellowstone National Park. For the GAL type of storm the air enters the North American continent relatively dry and is not near any other source of moisture. So, the precipitation tends to be light and scattered.

Fig. 29. Surface chart at 12Z on Wednesday, November 8, 2006.

Fig. 30. Surface chart at 12Z on Thursday, November 9, 2006.

Fig. 31. Surface chart at 12Z on Friday, November 10, 2006.

Fig. 32. Surface chart at 12Z on Saturday, November 11, 2006.

Fig. 33. Surface chart at 12Z on Sunday, November 12, 2006.

Fig. 34. Surface chart at 12Z on Monday, November 13, 2006.

Fig. 35. Surface chart at 12Z on Tuesday, November 14, 2006.
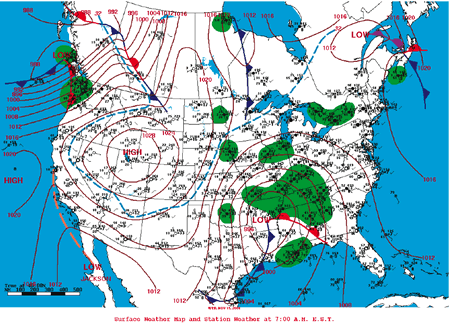
Fig. 36. Surface chart at 12Z on Wednesday, November 15, 2006.
Plunging Western Low (PWL) storm
(October 9–15, 2008)
The PWL storm was a single short wave which traveled over a high-pressure ridge in western Canada and plunged directly south along the west coast of North American in the Fall of 2008. This third type of storm occurs less frequently than the other two types already discussed but frequently produces heavy precipitation in Yellowstone National Park. This type of storm normally occurs in the spring, but can occur anytime throughout the winter precipitation season. It occurs when strong winds in the upper atmospheric jet stream become super-geostrophic upon rounding a sharp ridge. The winds cause a low-pressure trough to develop ahead of the ridge and drive the short wave southward. Super-geostrophic winds are ones which have higher wind speeds than those under balanced pressure gradient forces and Coreolis forces caused by the spinning of the earth. Super-geostrophic winds move across pressure contours during tight turns, increasing the pressure on the outside of the trajectory and decreasing the pressure inside. Changes in the pressure field caused by this effect, in turn, cause changes in the flow pattern and storm tracks.
Figs. 37–42 illustrate the atmospheric flow pattern at the 500-mb pressure level for the PWL case. Note the extreme “waviness” to the 500-mb flow during this case. During the six-day period of this case study one upper-level short wave moved through the ridge in the Gulf of Alaska, down the West Coast, and across Yellowstone National Park and the western United States. As the short wave moved from the Gulf of Alaska onto the North American continent the upper-level trough “closed off” and the winds around the center of the storm aloft became circular. The storm “stood” vertical as the center of the upper-level circulation became located directly over the low-pressure center at the surface. This short wave moved much more slowly than the other two types of storms at about 27km/hour (15 knots, 17 mph) even though the maximum upper-level winds around the storm center were as high as 183 km/hour (100 knots, 113 mph). The temperature in the center of the storm at the 500-mb level averaged about –30°C (–22°F).
Figs. 43–48 show the United States surface weather maps for the 6-day PWL storm period with the same meteorological elements as for the other two cases. The low pressure entering the northwest was very disorganized in the mountainous terrain, but formed a front from southern California to Nebraska by 12Z on Friday, October 10. As the circulation aloft closed off at 12Z on Saturday, October 11, a surface low-pressure center developed in southern Nevada and began moving slowly northeastward into Colorado on Sunday, October 12. The closed low aloft moved rapidly into eastern Montana and the Dakotas by 12Z on Monday, October 13, and then became an “open” wave as it sped across eastern Canada at 12Z on Tuesday, October 14. A weak upper-level low was left behind in the Four Corners area as the main storm raced off to the northeast. It is common for an upper-level closed low to be “kicked out” of its trough position and accelerate as it opens and occasionally leave an isolated circulation pattern behind. These isolated circulations in the atmosphere are similar to eddies seen along the edges of a river which have separated from the main flow.
Yellowstone National Park never experienced a true frontal passage during this storm. The short wave moved southward along the West Coast to the west, rotated around the bottom of the trough in southern California, Arizona, and New Mexico, and then moved northeastward to the east of the Park. Surface winds throughout most of the 6 days of this storm were from the southeast at about 10 knots except for Sunday and Monday, October 12 and 13, when the storm was moved rapidly northeastward out of the region. Unlike most other types of storms which have flows from the west, this storm generally had easterly flow at the surface and aloft over Yellowstone National Park.
The precipitation field associated with the PWL storm was larger and much better organized than for the CZF and GAL cases. At 12Z on Friday, October 10, a fairly sizable area of precipitation developed directly over Montana and Wyoming. This area grew much larger on Saturday and Sunday, October 11 and 12, while the upper-level and surface lows were relatively slow moving. Precipitation was primarily to the north and west of the surface low-pressure center and warm front. By 12Z on Monday, October 13, when the lows began to accelerate northward, the precipitation area became smaller and was closer to the cold front. At 12Z on Tuesday, October 14, a large area of precipitation developed ahead of the closed low aloft left behind over New Mexico, Texas, Oklahoma, and southern Kansas.
Precipitation fell in Yellowstone National Park primarily during two periods of this storm—when the short wave plunged southward along the West Coast and again when the storm center was located in the southwest and moving slowly northward into Colorado on Saturday and Sunday, October 11 and 12. The precipitation in the second portion of the storm was heavier and more widespread because it was in the warm sector of the storm which was rotating counterclockwise. This meant the wind was from the east on the north and east sides of the storm center. Precipitation was formed in the Park as the air flow from the east was lifted orographically.
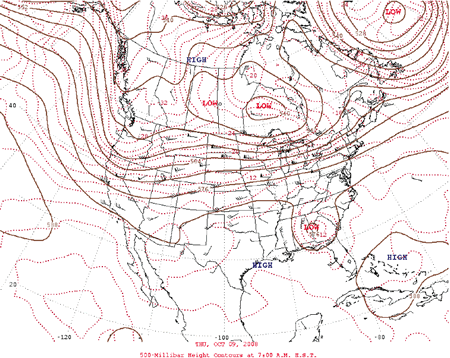
Fig. 37. 500-mb chart at 12Z on Thursday, October 9, 2008.
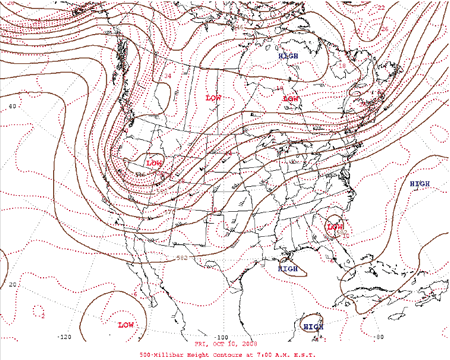
Fig. 38. 500-mb chart at 12Z on Friday, October 10, 2008.
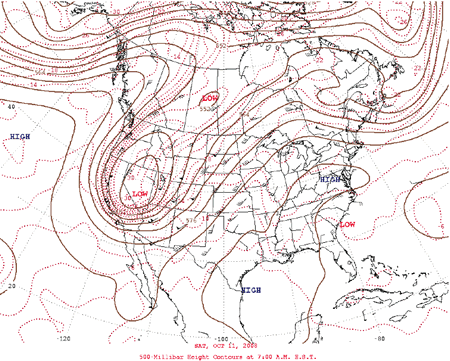
Fig. 39. 500-mb chart at 12Z on Saturday, October 11, 2008.
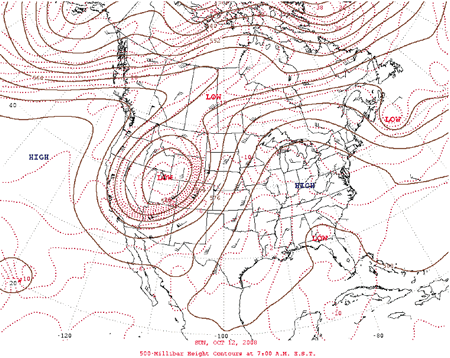
Fig. 40. 500-mb chart at 12Z on Sunday, October 12, 2008.

Fig. 41. 500-mb chart at 12Z on Monday, October 13, 2008.
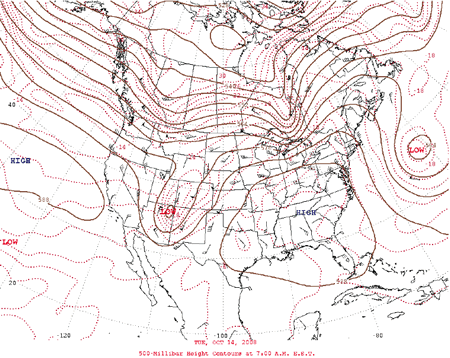
Fig. 42. 500-mb chart at 12Z on Tuesday, October 14, 2008.
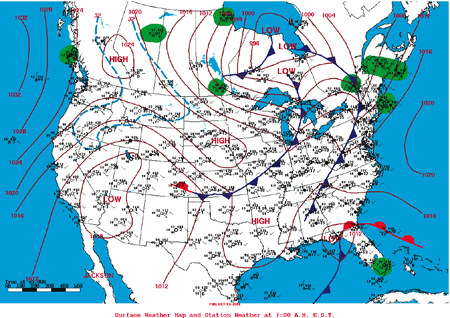
Fig. 43. Surface chart at 12Z on Thursday, October 9, 2008.
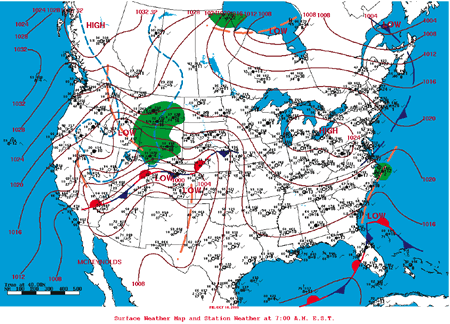
Fig. 44. Surface chart at 12Z on Friday, October 10, 2008.
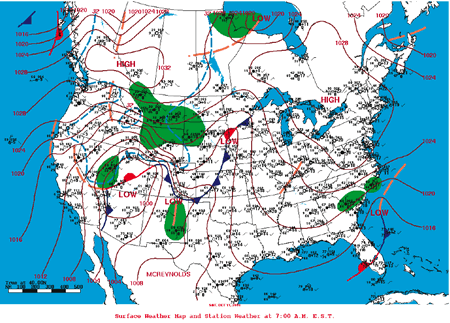
Fig. 45. Surface chart at 12Z on Saturday, October 11, 2008.
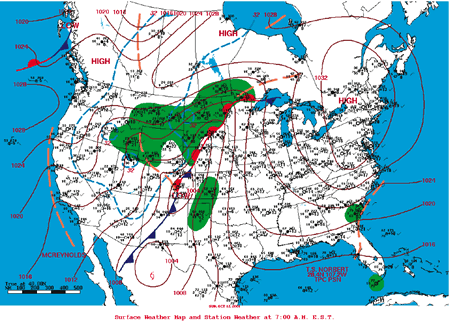
Fig. 46. Surface chart at 12Z on Sunday, October 12, 2008.
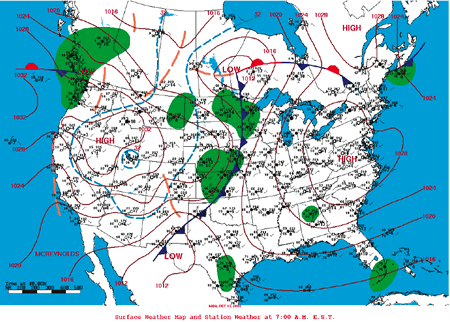
Fig. 47. Surface chart at 12Z on Monday, October 13, 2008.
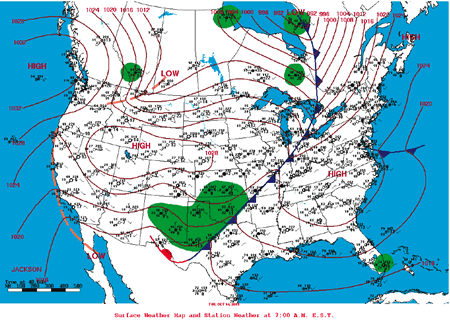
Fig. 48. Surface chart at 12Z on Tuesday, October 14, 2008.
Sea-Surface Temperature
Fig. 49 shows the distribution of actual sea-surface temperatures over the eastern Pacific Ocean during the CZF case. The sea-surface temperature of the green and purple regions over which the air flowed before reaching the West Coast for the actual case averaged about 283 K (10°C, 50°F). As the air moved over the ridge in the Gulf of Alaska, it moved over cold water and then swept southward over warmer water before crossing the northwest coast and into the Rocky Mountains. Depending upon the position of the individual storms entering Yellowstone National Park, the air ahead of the fronts was relatively warm and behind the fronts the air was dramatically colder.
Fig. 50 shows the distribution of actual sea-surface temperatures over the eastern Pacific Ocean during the GAL case. The sea-surface temperature of the purple region over which the air flowed before reaching the northwest coast and Yellowstone National Park for the actual case averaged about 285 K (12°C, 54°F) and reached as far south as San Francisco.
Fig. 51 shows the distribution of actual sea-surface temperature over the eastern Pacific Ocean during the PWL case. The sea-surface temperature of the purple region over which the air flowed before reaching the northwest coast and Yellowstone National Park for the actual case averaged about 287 K (14°C, 57°F). These moderate temperatures reached south of San Francisco along the West Coast.
Precipitation
The Continuous Zonal Flow (CZF) Case
A series of storms from Christmas Day 2005 through New Year’s Day brought heavy to excessive amounts of precipitation across southwest Oregon, northern California, and western Nevada resulting in widespread flooding. The most potent short wave moved into the region on December 30, 2005, before exiting the area on New Year’s Eve. This system rode in on an impressive zonal Pacific jet stream between 30°N and 40°N. Copious amounts of subtropical moisture were entrained into this system with a source traced back to the Philippines and Indonesia. Under a strong warm air advection pattern, snow levels rose above many mountaintops, allowing for precipitation to fall mainly as rain. With the region under a tropical air mass, warm rain processes dominated, allowing for high precipitation efficiencies. Warm rain processes only involve rain—not snow. This exacerbated the potential for flooding in California given the high amounts of runoff expected, especially over the crest of the Sierra Nevada and along the east slopes. The storms proceeded into the intermountain region of Nevada, Wyoming, Montana, and Colorado with less moisture but good dynamics. Strong mid-level winds provided enhanced orographic precipitation on southwest facing slopes. Wind magnitudes at 700 mb about 16 km (~10,000 ft altitude) approached 150 km/hr (80 knots, 90 mph), stronger than any storms of the recent past. One key ingredient was the slow movement of the system through the region. With the jet stream positioned parallel to the cold front, southward progression of the front was limited. In addition, late on December 30, 2005, an upper level disturbance developed along the cold front, allowing the system to stall over the San Francisco North Bay counties inland to the northern Sierra including the Lake Tahoe and Reno areas. This resulted in some of the greatest 24-hour amounts to be observed in these areas during the storm’s progression through the region. Each of these previously mentioned factors contributed to the heavy to excessive amounts of precipitation experienced across the West Coast region.
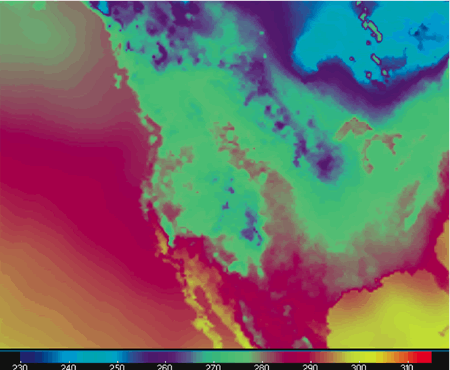
Fig. 49. Distribution of sea-surface temperature in the eastern Pacific Ocean for the Continuous Zonal Flow case. Temperatures on color bar are in K. (°C = K – 273, °F = 9/5°C + 32).
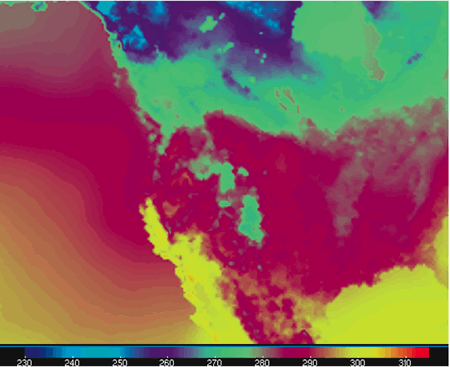
Fig. 50. Distribution of sea-surface temperature in the eastern Pacific Ocean for the Gulf of Alaska Low case. Temperatures on the color bar are in K. (°C = K – 273, °F = 9/5°C + 32).
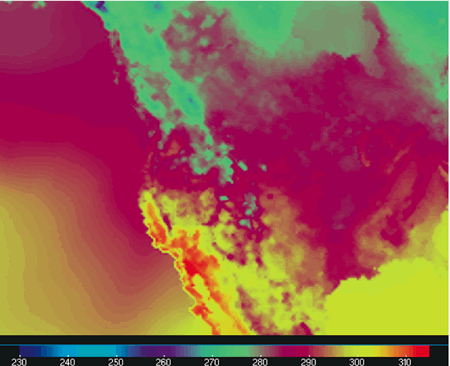
Fig. 51. Distribution of sea-surface temperature in the eastern Pacific Ocean for the Plunging Western Low case. Temperatures on the color bar are in K. (°C = K – 273, °F = 9/5°C + 32).
Fig. 52 shows an example of the 24-hour precipitation accumulation during the CZF case ending on Thursday morning, December 29, 2005. Note the heavy precipitation along the West Coast and lighter, more widespread precipitation over the intermountain region, including Yellowstone National Park.
The Gulf of Alaska (GAL) Case
The short waves for the GAL case swept from northwest to southeast from the Gulf of Alaska across the northwest and the intermountain region leaving swaths of precipitation across southern Canada, Washington, Idaho, Montana, Wyoming, and the Dakotas. Fig. 53 shows an example of the path of 24-hour precipitation accumulation across Yellowstone National Park from the second short wave in the GAL case ending at 12Z on Friday, November 10. Note, except for heavy precipitation on the northwest Washington coast, most of the heaviest precipitation occurred over Montana and Wyoming. Precipitation from the first wave and the third waves was more scattered over the Yellowstone region.
The Plunging Western Low (PWL) Case
The short wave during the PWL case plunged down the West Coast of the United States leaving a path of light precipitation along the coast and in the intermountain region. Because the center of the storm dropped so rapidly to its southerly position over southern California and Arizona, it only left light precipitation along its initial track. However, when it slowed at the bottom of its path and began to follow a path northeastward across the Rocky Mountains and into the northern Great Plains, it developed a massive shield of precipitation ahead and north of the storm center and cold front. Fig. 54 shows an example of the 24-hour precipitation accumulation as the short wave moved across Colorado ending on Sunday, October 12 at 12Z. Notice the heavy precipitation over the front range of Colorado and across Wyoming, Montana, the Dakotas, and Minnesota. It is common for this type of storm to produce heavy precipitation as it begins to lift out of its most southerly position and then decrease the precipitation at any given location as it accelerates. Storms like this in the early fall or in late spring will often break many branches from trees which still have their leaves.
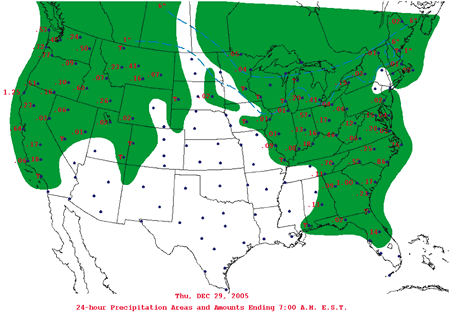
Fig. 52. Precipitation for the 24-hour period ending 12Z Thursday, December 29, 2005.
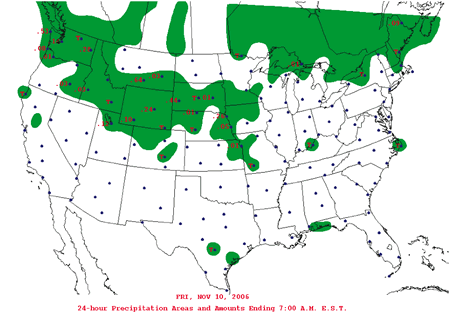
Fig. 53. Precipitation for the 24-hour period ending 12Z Friday, November 10, 2006.
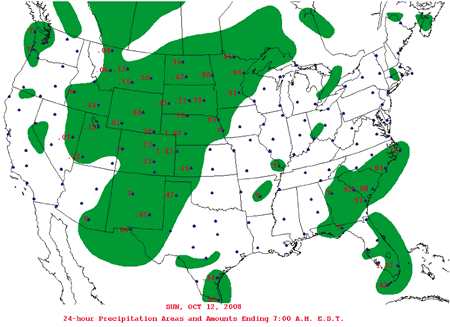
Fig. 54. Precipitation for the 24-hour period ending 12Z Sunday, October 12, 2008.
Numerical Simulation of the Continuous Zonal Flow, Gulf of Alaska Low, and Plunging Western Low Cases
Vardiman (2008) originally proposed simulating storms in Yellowstone National Park using the NCAR Mesoscale Meteorology Model (MM5) (NCAR 2003). However, by the time the project began in the Fall of 2008 a new model called the Weather Research and Forecasting Model (WRF) (NCAR 2007) was available with updated capabilities. It is based on similar procedures as MM5 and contains many of the same subroutines. It was decided to use the WRF model for the project rather than the older MM5 model because it has more capabilities and is actively supported.
WRF was installed on the EPIPHANY 44-node parallel processor at the Institute for Creation Research offices in Dallas, Texas, in the fall of 2008. Wes Brewer developed the support software for inputting and storing the data needed for conducting simulations at Yellowstone. Topographic data for the Western U. S. and meteorological data for the CZF, GAL, and PWL cases were imported into the model. These data were available from NCAR by exercising subroutines within WRF.
Fig. 55 shows the three spatial domains which were established for simulations of the Yellowstone cases, all centered on Lake Yellowstone Lodge, at 2,368 m (7,770 ft) elevation near the center of Yellowstone National Park. The three domains allow simulations to be conducted over progressively larger areas with coarser resolutions. The smallest domain has dimensions about 630 km (391 mi) east/west and about 480 km (298 mi) north/south with a 3-km (1.86 mi) grid spacing. The medium domain is three times as large as the smallest domain with dimensions of about 1,890 km (1,174 mi) east/west and about 1,440 km (894 mi) north/south and a grid spacing of 9 km (5.6 mi). The largest domain is nine times as large as the smallest domain with dimensions of about 5,600 km (3,478 mi) east/west and 4,320 km (2,683 mi) north/south with a grid spacing of 27 km (16.8 mi).
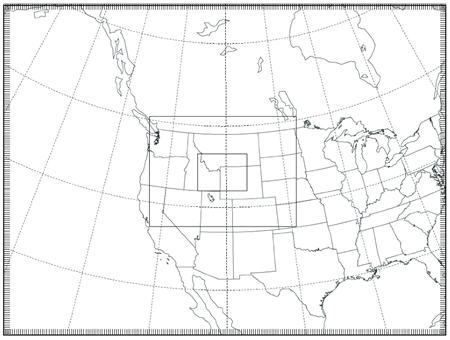
Fig. 55. Three spatial domains established for the simulation of storms in Yellowstone National Park. The large domain is about 5,670 km (3,523 mi) east/west and about 4,320 km (2,684 mi) north/south, the medium domain is about 1,890 km (1,174 mi) east/west and about 1,440 km (895 mi) north/south, and the small domain is about 630 km (391 mi) east/west and about 480 km (298 mi) north/south.
Validation of WRF for the Continuous Zonal Flow, Gulf of Alaska Low, and Plunging Western Low Cases
WRF has numerous subroutines and parameters which can be activated and adjusted for various conditions. For example, some of the cloud physics subroutines are appropriate for cold winter storms and others for warm tropical storms. Turbulence and mixing can be adjusted in the dynamics portion of the model. Various radiation codes are available and boundary conditions can be modified. Normally, these subroutines and parameters are adjusted until the computed precipitation from WRF matches the observed precipitation.
The validation method used in the CZF, GAL, and PWL case studies was to set the various parameters in the WRF model according to the conditions expected in winter orographic storms and compare the computed total storm precipitation with the observed storm precipitation at a number of locations in the vicinity of Yellowstone National Park. Figs. 56, 58, and 60 show the total WRF computed storm precipitation on the smallest domain for the CZF, GAL, and PWL cases, respectively, using the observed sea-surface temperatures. Figs. 57, 59, and 61 show comparisons between the computed and actual storm total precipitation for each of the storms. Tables 1, 2, and 3 provide stations identifiers and other information for sites shown on the graph.
The stations in the upper right portion of Fig. 57 are generally to the west of Yellowstone National Park. This is on the upwind side of the continental divide and in the updraft region of storms coming from the west and southwest. The stations in the lower left hand corner are typically in the mountains and to the east of the continental divide. The regression coefficient between computed and observed total storm precipitation was about 0.65. This means that only approximately 42% of the observed precipitation over the Yellowstone National Park area can be explained by the WRF model.
The magnitude of the WRF computed precipitation was about twice the observed precipitation for the higher precipitation rates and even greater for the smaller precipitation rates. Most of this disparity was probably due to the poor collection efficiency of precipitation gages for snow under windy conditions. The maximum fall velocity of snow crystals is about 1 m/s (~6 ft/sec) and is much less for snow typical of cold winter storms in the mountains. Even for light winds of 10 km/hour (~6 mph) and gages equipped with wind shields to slow the wind above the gage to improve the collection efficiency, the precipitation gage efficiency for fast-falling snow in the mountains is on the order of 50%. For stronger winds and slower-falling snow the efficiency can decrease to 20% or less. So, it’s not surprising that the computed precipitation rates would be twice the observed precipitation rates, or more.
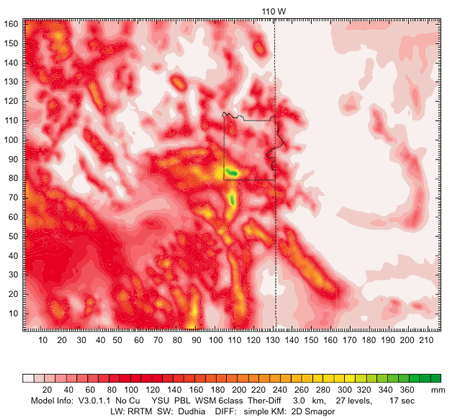
Fig. 56. Total Continuous Zonal Flow storm precipitation for validation study with observed sea-surface temperature of approximately 10°C (50°F). East/west and north/south distances are in number of grid cells, each 3 km (1.86 mi) wide, for a total of 630 km (391 mi) east/west and 480 km (298 mi) north/south. The boundary of Yellowstone National Park is indicated near the center of the domain. The run time was 10 days.
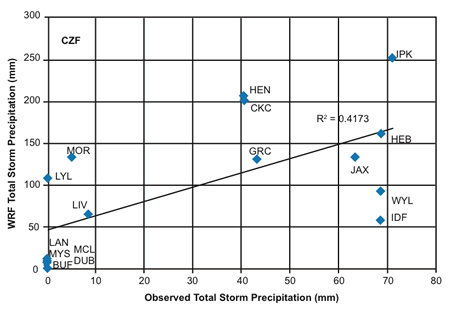
Fig. 57. Comparison of WRF total 10-day computed precipitation versus Continuous Zonal Flow 10-day total observed storm precipitation in millimeters.
Fig. 57 shows a moderately good correlation for precipitation measurements in the complex terrain of the Yellowstone region. In addition to the limitations on accurate model prediction discussed in the PEX case study in Yosemite National Park by Vardiman and Brewer (2010), the CZF case in Yellowstone exaggerates these problems somewhat because of wide fluctuations in temperature and wind direction before and behind the short waves. Ahead of the short wave the surface wind will be from the south/southeast and the temperature will be relatively warm. Shortly after the short wave passes, the surface wind will switch to the west/northwest and the temperature will drop dramatically. Frequently the air will become highly unstable behind the front and convection will break out. Convection is hard to capture accurately in the precipitation gage network because of its small horizontal scale. The correlation between computed and observed precipitation for the CZF case study is judged to be moderately good.
Table 1. Station name, ID, latitude, longitude, elevation, and observed and computed precipitation for the Continuous Zonal Flow case shown in Fig. 56.
| Station | ID | Latitude | Longitude | Elevation (m) | Elevation (ft) | Observed (mm) | WRF (mm) |
|---|---|---|---|---|---|---|---|
| Idaho Falls | IDF | 43.52 | 112.07 | 1442 | 4729 | 68.58 | 57.53 |
| Island Park | IPK | 44.42 | 111.37 | 1918 | 6290 | 71.12 | 251.14 |
| Henry | HEN | 42.95 | 111.43 | 2024 | 6644 | 40.64 | 205.58 |
| Grace | GRC | 42.58 | 111.73 | 1691 | 5550 | 43.18 | 131.33 |
| Livingston | LIV | 45.48 | 110.57 | 1484 | 4870 | 8.38 | 64.6 |
| Mcleod | MCL | 45.67 | 110.12 | 1465 | 4809 | 0 | 8.93 |
| Mystic Lake | MYS | 45.25 | 109.73 | 1994 | 6544 | 0 | 5.15 |
| Hebgen Dam | HEB | 44.87 | 111.33 | 1977 | 6489 | 68.58 | 161.98 |
| West Yellowstone | WYL | 44.67 | 111.1 | 2029 | 6660 | 68.58 | 92.05 |
| Buffalo Bill Dam | BUF | 44.50 | 109.17 | 1577 | 5175 | 0 | 1.85 |
| Dubois | DUB | 43.53 | 109.65 | 2119 | 6955 | 0 | 4.03 |
| Jackson | JAX | 43.48 | 110.77 | 1898 | 6230 | 63.5 | 134.19 |
| Moran | MOR | 43.85 | 110.58 | 2071 | 6798 | 5.08 | 132.39 |
| Lake Yellowstone | LYL | 44.57 | 110.4 | 2398 | 7870 | 0 | 108.99 |
| Cooke City | CKC | 45.02 | 109.95 | 2281 | 7483 | 40.64 | 203.34 |
| Lander Airport | LAN | 42.82 | 108.73 | 1693 | 5557 | 0 | 12.83 |
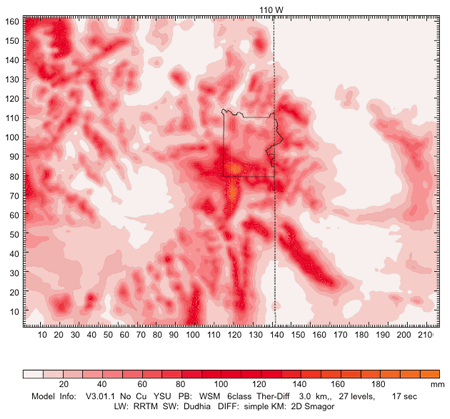
Fig. 58. Total Gulf of Alaska Low storm precipitation for validation study with observed sea-surface temperature of approximately 12°C (54°F). East/west and north/south distances are in number of grid cells, each 3 km (1.86 mi) wide, for a total of 630 km (391 mi) east/west and 480 km (298 mi) north/south. The boundary of Yellowstone National Park is indicated near the center of the domain. The run time was ten days.
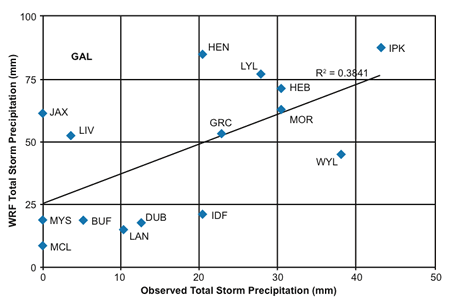
Fig. 59. Comparison of WRF 10-day total computed precipitation versus Gulf of Alaska Low 10-day total observed storm precipitation in millimeters.
Table 2. Station name, ID, latitude, longitude, elevation, and observed and computed precipitation for the Gulf of Alaska Low case shown in Fig. 57.
| Station | ID | Latitude | Longitude | Elevation (m) | Elevation (ft) | Observed (mm) | WRF (mm) |
|---|---|---|---|---|---|---|---|
| Idaho Falls | IDF | 43.52 | 112.07 | 1442 | 4729 | 20.32 | 20.75 |
| Island Park | IPK | 44.42 | 111.37 | 1918 | 6290 | 43.18 | 87.08 |
| Henry | HEN | 42.95 | 111.43 | 2024 | 6644 | 20.32 | 84.54 |
| Grace | GRC | 42.58 | 111.73 | 1691 | 5550 | 22.86 | 52.68 |
| Livingston | LIV | 45.48 | 110.57 | 1484 | 4870 | 3.81 | 51.97 |
| Mcleod | MCL | 45.67 | 110.12 | 1465 | 4809 | 0 | 8.14 |
| Mystic Lake | MYS | 45.25 | 109.73 | 1994 | 6544 | 0 | 18.27 |
| Hebgen Dam | HEB | 44.87 | 111.33 | 1977 | 6489 | 30.48 | 71.05 |
| West Yellowstone | WYL | 44.67 | 111.1 | 2029 | 6660 | 38.1 | 44.53 |
| Buffalo Bill Dam | BUF | 44.50 | 109.17 | 1577 | 5175 | 5.08 | 18.67 |
| Dubois | DUB | 43.53 | 109.65 | 2119 | 6955 | 12.7 | 17.26 |
| Jackson | JAX | 43.48 | 110.77 | 1898 | 6230 | 0 | 61.04 |
| Moran | MOR | 43.85 | 110.58 | 2071 | 6798 | 30.48 | 62.24 |
| Lake Yellowstone | LYL | 44.57 | 110.4 | 2398 | 7870 | 27.94 | 76.66 |
| Lander Airport | LAN | 42.82 | 108.73 | 1693 | 5557 | 10.41 | 15.22 |
The stations in the upper right portion of Fig. 59 for the GAL case are also generally to the West of Yellowstone National Park on the upwind side of the continental divide and in the updraft region of airflow coming from the west and southwest. However, since the GAL storms came from more from the northwest than the CZF storms, a smaller percentage of the storms had a southwest component. The stations in the lower, left corner of Fig. 59 were typically to the south and east of the highest terrain in Yellowstone National Park. The regression coefficient between computed and observed total storm precipitation was 0.62. This means that approximately 38% of the observed precipitation over the Yellowstone National Park region was explained by the WRF model.
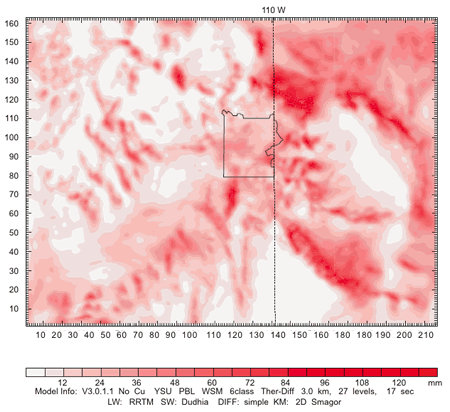
Fig. 60. Total Plunging Western Low storm precipitation for validation study with observed sea-surface temperature of approximately 14°C (63°F). East/west and north/south distances are in number of grid cells, each 3 km (1.86 mi) wide, for a total of 630 km (391 mi) east/west and 480 km (298 mi) north/south. The boundary of Yellowstone National Park is indicated near the center of the domain. The run time was 10 days.
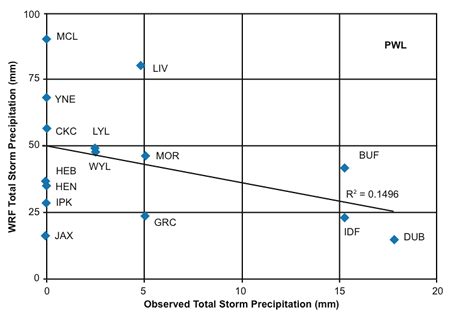
Fig. 61. Comparison of WRF 10-day total computed precipitation versus Plunging Western Low 10-day total observed storm precipitation in millimeters.
Like the CZF case the WRF computed precipitation was about twice that of the observed precipitation. The same arguments apply for this disparity.
This is a slightly poorer correlation for precipitation for the GAL case than for the CZF case, but not nearly as good as the PEX case study reported in Vardiman and Brewer (2010). The main reasons for the poorer correlation are the complex terrain and the more variable flow from the northwesterly direction. The correlation between computed and observed precipitation for the GAL case study is judged to be somewhat weaker, but still moderately good.
Table 3. Station name, ID, latitude, longitude, elevation, and observed and computed precipitation for the Plunging Western Low case shown in Fig. 58.
| Station | ID | Latitude | Longitude | Elevation (m) | Elevation (ft) | Observed (mm) | WRF (mm) |
|---|---|---|---|---|---|---|---|
| Idaho Falls | IDF | 43.52 | 112.07 | 1442 | 4729 | 15.24 | 22.59 |
| Island Park | IPK | 44.42 | 111.37 | 1918 | 6290 | 0 | 28.8 |
| Henry | HEN | 42.95 | 111.43 | 2024 | 6644 | 0 | 35.22 |
| Grace | GRC | 42.58 | 111.73 | 1691 | 5550 | 5.08 | 23.66 |
| Livingston | LIV | 45.48 | 110.57 | 1484 | 4870 | 4.83 | 80.06 |
| Mcleod | MCL | 45.67 | 110.12 | 1465 | 4809 | 0 | 90.86 |
| Hebgen Dam | HEB | 44.87 | 111.33 | 1977 | 6489 | 0 | 36.77 |
| West Yellowstone | WYL | 44.67 | 111.1 | 2029 | 6660 | 2.54 | 47.82 |
| Buffalo Bill Dam | BUF | 44.50 | 109.17 | 1577 | 5175 | 15.24 | 41.66 |
| Dubois | DUB | 43.53 | 109.65 | 2119 | 6955 | 17.78 | 14.55 |
| Jackson | JAX | 43.48 | 110.77 | 1898 | 6230 | 0 | 16.37 |
| Moran | MOR | 43.85 | 110.58 | 2071 | 6798 | 5.08 | 46.12 |
| Lake Yellowstone | LYL | 44.57 | 110.4 | 2398 | 7870 | 2.54 | 48.98 |
| Yellowstone NE Entrance | YNE | 44.48 | 110 | 2120 | 6952 | 0 | 67.56 |
| Cooke City | CKC | 45.02 | 109.95 | 2281 | 7483 | 0 | 56.68 |
The stations in Fig. 61 for the PWL case show a very poor relationship to elevation and location relative to Yellowstone National Park. The regression coefficient between computed and observed total storm precipitation was 0.39 and the relation is inversely correlated because of the negative slope of the regression line. This means that only about 15% of the observed precipitation over the Yellowstone National Park region was statistically explained by the WRF model. In addition, the correlation doesn’t make physical sense because of the negative correlation. The poor correlation can most likely be explained by the extreme variation in the position of updrafts and precipitation as the short wave for the PWL moved rapidly southward on the west side of the Yellowstone area during the first portion of the storm and then moved slowly northward on the east side of the Yellowstone area. The position of the orographic component of the precipitation was in constant transition over the complex terrain. The WRF model was apparently unable to handle such a complicated situation.
One of the reviewers suggested another possible reason for why WRF had difficulty in predicting the precipitation accurately. He suggested that the storm patterns caused strong down slope drying at Island Park, Henry Lake, Hebgen Dam, West Yellowstone, and Jackson. Much of the precipitation may have been milked out along the northeast facing orography, even at low elevations such as at Billings, Lewistown and Great Falls, Montana. So the air became drier at the upper elevations. He was surprised at zero precipitation at Yellowstone NE Entrance and Cooke City, but probably these stations got too much down slope drying from the Beartooth Mountains. For WRF to accurately simulate this pattern, it must have very accurate terrain and low level wind fields, which is probably beyond the state of the art in this region at this moment in model development.
The correlation between computed and observed precipitation for the PWL case study is judged to be very poor. It may be possible to improve the ability of WRF to predict precipitation in future simulations over the Yellowstone region for this storm if it were broken into two or more periods.
Numerical Simulation of Precipitation for Six Sea-Surface Temperatures
The CZF storm, the GAL, and the PWL storms were simulated with the WRF model for six different sea-surface temperatures for the Eastern Pacific Ocean (0°C [32°F], 10°C [50°F], 20°C [68°F], 30°C [86°F], 40°C [104°F], and 45°C [113°F]). The purpose was to determine the effect of sea-surface temperature on total storm precipitation in Yellowstone National Park and the surrounding areas. The maximum sea-surface temperature possible was at 45°C (113°F), for consistent results with moderate time steps and run times. When running models such as WRF, the parameters are usually adjusted to work well within the range of normally observed temperatures. When sea-surface temperature rises to 30°C (86°F) or above, the parameters of the model may not be adjusted to such hot temperatures and therefore, one can get spurious results. But, this probably did not happen at least for sea-surface temperatures less than or equal to 40° (104°F), as the results generally seem logical and as expected with such warm sea-surface temperatures.
Accumulation of precipitation as a function of time and sea-surface temperature
Figs. 62–64 display the accumulated WRF model precipitation as a function of simulation time and sea-surface temperature for the CZF, GAL, and PWL storms, respectively. The accumulated precipitation shown here is for the maximum precipitation at all grid points within the Yellowstone National Park boundaries shown in Figs. 65–81 to follow.
The accumulation curves behave unusually as a function of sea-surface temperature. Vardiman and Brewer (2010a, 2010b) reported that the accumulation curves in Yosemite National Park generally reached larger amounts of precipitation as sea-surface temperature increased, although with some irregularities. For Yellowstone National Park here, however, the accumulation curves generally started with moderate values of precipitation at sea-surface temperature = 0°C (32°F) and then decreased as sea-surface temperature increased, reaching minimum values for sea-surface temperature = 30°C (86°F), then, increased again at sea-surface temperatures equal to 40°C (104°F) and 45°C (113°F).
Fig. 62 shows the accumulation curves for the CZF storm as a function of time and sea-surface temperature. The maximum total accumulated WRF model precipitation in Yellowstone National Park reached a value of about 250 mm (~10 in) at the end of the 10-day storm for a sea-surface temperature of 0°C (32°F). For sea-surface temperature = 10°C (50°F) the total accumulated precipitation was also about 250 mm (10 in). At sea-surface temperature = 20°C (68°F) it increased to about 400 mm, (16 in) then decreased to about 100 mm (4 in) at sea-surface temperature = 30°C (86°F). At sea-surface temperature = 40°C (104°F) it increased to about 500 mm (20 in) and then approached 1,000 mm (40 in) at sea-surface temperature = 45°C (113°F).
Fig. 63 shows the accumulation curves for the GAL storm as a function of time and sea-surface temperature. The accumulated precipitation at the end of this 8-day storm reached a value of about 100 mm (4 in) for sea-surface temperatures of 0°C (32°F), 10°C (50°F), 20°C (68°F), and 30°C (86°F). But, at sea-surface temperature = 40°C (104°F) the precipitation reached about 200 mm (8 in) and for sea-surface temperature = 45°C (113°F) it exceeded 1,000 mm (40 in).
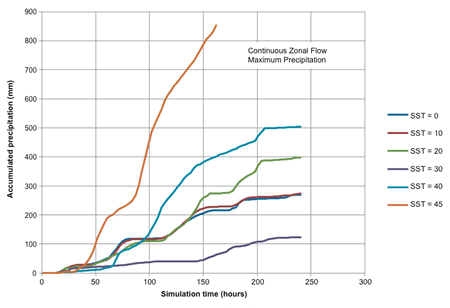
Fig. 62. Accumulated WRF model precipitation for the Continuous Zonal Flow storm in Yellowstone National Park as a function of simulation time and sea-surface temperature °C.
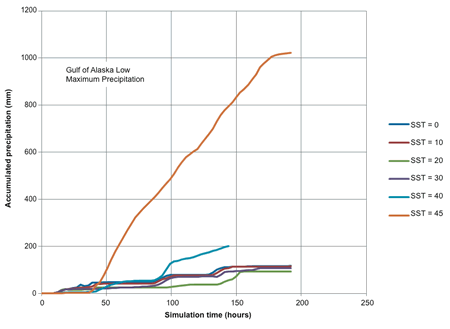
Fig. 63. Accumulated WRF model precipitation for the Gulf of Alaska Low storm in Yellowstone National Park as a function of simulation time and sea-surface temperature °C.
Fig. 64 shows the accumulation curves for the PWL storm as a function of time and sea-surface temperature. The accumulated precipitation at the end of this 6-day storm reached a value of about 120 mm (4.8 in) for a sea-surface temperature = 0°C (32°F), then decreased to about 90 mm (4 in) at a sea-surface temperature = 10°C (50°F), 80 mm (3 in) at a sea-surface temperature = 20°C (68°F), and 10 mm (½ in) at a sea-surface temperature = 30°C (86°F). But, then for a sea-surface temperature = 40°C (104°F) the accumulated precipitation suddenly jumped to about 180 mm. Although the magnitude of the accumulated precipitation in Yellowstone National Park for the PWL storm shown in Fig. 86 is much less than that for the CZF and GAL cases, it shows a similar pattern with sea-surface temperature.
By comparing the trends of these precipitation accumulation curves with the small-scale horizontal distributions and magnitude of precipitation shown in Figs. 65–81, the relation in the location of precipitation patterns to mountain barriers shown in Figs.
62–64, and the large-scale horizontal distribution and magnitude of precipitation shown in Fig. 84, it is evident that a large-scale dynamic effect is produced by warmer sea-surface temperatures. It may be possible to pursue this phenomenon by analyzing the three-dimensional flow fields stored in the output from the simulations. However, this effort is beyond the scope of this report at this time. It is also possible that the decrease in precipitation for sea-surface temperatures from 0°C (32°F) to 30°C (86°F) and increasing precipitation for warmer sea-surface temperatures is simply an anomalous result.
Precipitation accumulates more rapidly for the warmest sea-surface temperatures for all three storms somewhat similar to that reported in Yosemite National Park by Vardiman and Brewer (2010a, 2010b). The difference was about 250 mm between a sea-surface temperature of 0°C (32°F) and 40°C (113°F) and 500 mm (20 in) between 40°C (104°F) and 45°C (113°F) for the CZF storm. The difference in accumulation was about 100 mm (4 in) between a sea-surface temperature of 0°C (32°F) and 40°C (104°F) and 800 mm (32 in) between 40°C (104°F) and 45°C (113°F) for the GAL storm. For the PWL storm the difference in accumulation was about 60 mm (2½ in) between 0°C (32°F) and 40°C (104°F), but no value was available for sea-surface temperature = 45°C (113°F). This increasing difference in accumulation rate with temperature would be expected since the rate of growth of snow in clouds and the formation of precipitation should be proportional to the water vapor available for cloud processes. But, the amount of water vapor is an exponential function of sea-surface temperature as governed by the Clausius-Clapeyron equation. This is a well-known chemical-physics equation that relates water vapor pressure in air to the temperature of a nearby water surface.
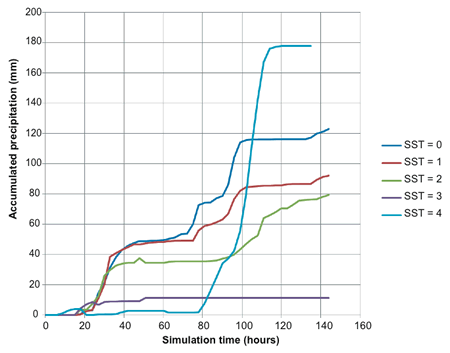
Fig. 64. Accumulated WRF model precipitation for the Plunging Western Low storm in Yellowstone National Park as a function of simulation time and sea-surface temperature °C.
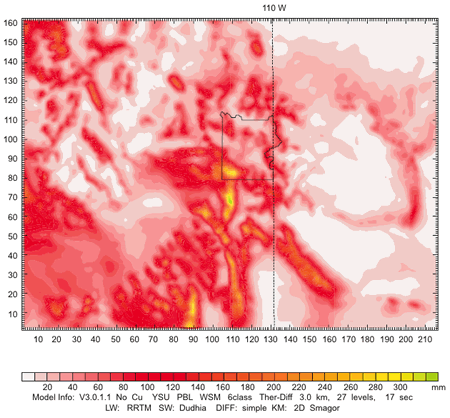
Fig. 65. Total Continuous Zonal Flow storm precipitation for sea-surface temperature =0°C (32°F). East/west and north/south distances are in number of grid cells, each 3 km (1.86 mi) wide, for a total of 630 km (391 mi) east/west and 480 km (298 mi) north/south. The boundary of Yellowstone National Park is indicated near the center of the domain. The run time was ten days.
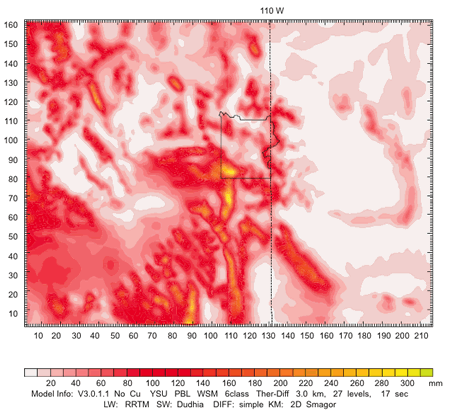
Fig. 66. Total Continuous Zonal Flow storm precipitation for sea-surface temperature = 10°C (50°F). East/west and north/south distances are in number of grid cells, each 3 km (1.86 mi) wide, for a total of 630 km (391 mi) east/west and 480 km (298 mi) north/south. The boundary of Yellowstone National Park is indicated near the center of the domain. The run time was ten days.
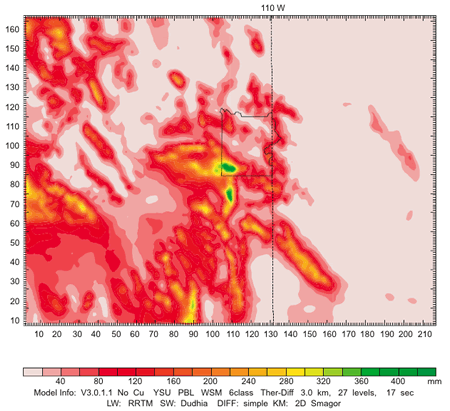
Fig. 67. Total Continuous Zonal Flow storm precipitation for sea-surface temperature = 20°C (68°F). East/west and north/south distances are in number of grid cells, each 3 km (1.86 mi) wide, for a total of 630 km (391 mi) east/west and 480 km (298 mi) north/south. The boundary of Yellowstone National Park is indicated near the center of the domain. The run time was ten days.
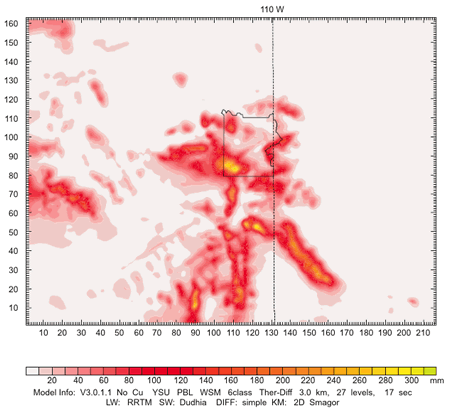
Fig. 68. Total Continuous Zonal Flow storm precipitation for sea-surface temperature = 30°C (86°F). East/west and north/south distances are in number of grid cells, each 3 km (1.86 mi) wide, for a total of 630 km (391 mi) east/west and 480 km (298 mi) north/south. The boundary of Yellowstone National Park is indicated near the center of the domain. The run time was ten days.
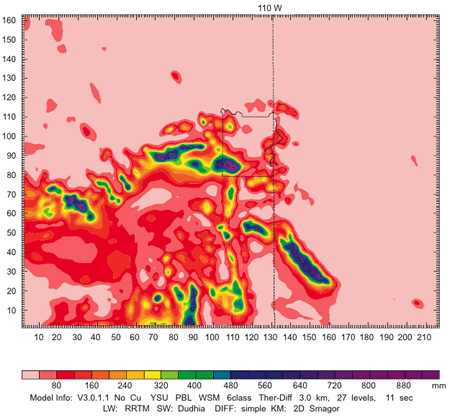
Fig. 69. Total Continuous Zonal Flow storm precipitation for sea-surface temperature = 40°C (104°F). East/west and north/south distances are in number of grid cells, each 3 km (1.86 mi) wide, for a total of 630 km (391 mi) east/west and 480 km (298 mi) north/south. The boundary of Yellowstone National Park is indicated near the center of the domain. The run time was ten days.
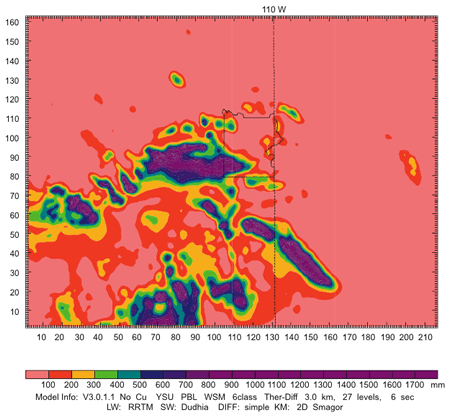
Fig. 70. Total Continuous Zonal Flow storm precipitation for sea-surface temperature = 45°C (113°F). East/west and north/south distances are in number of grid cells, each 3 km (1.86 mi) wide, for a total of 630 km (391 mi) east/west and 480 km (298 mi) north/south. The boundary of Yellowstone National Park is indicated near the center of the domain. The run time was ten days.
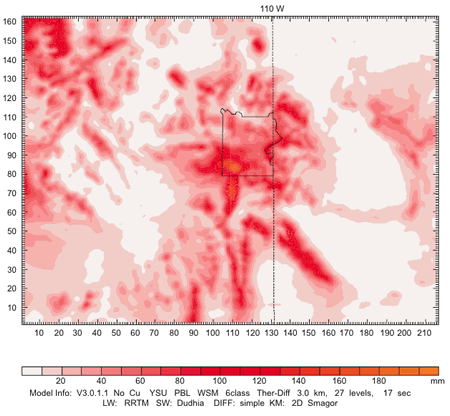
Fig. 71. Total Gulf of Alaska Low storm precipitation for sea-surface temperature = 0°C (32°F). East/west and north/ south distances are in number of grid cells, each 3 km 1.86 mi) wide, for a total of 630 km (391 mi) east/west and 480 km (298 mi) north/south. The boundary of Yellowstone National Park is indicated near the center of the domain. The run time was ten days.
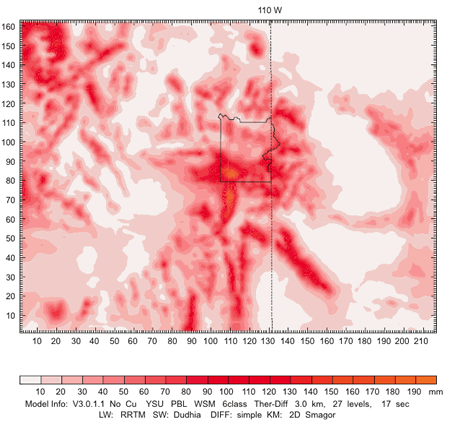
Fig. 72. Total Gulf of Alaska Low storm precipitation for sea-surface temperature = 10°C (50°F). East/west and north/south distances are in number of grid cells, each 3 km (1.86 mi) wide, for a total of 630 km (391 mi) east/west and 480 km (298 mi) north/south. The boundary of Yellowstone National Park is indicated near the center of the domain. The run time was ten days.
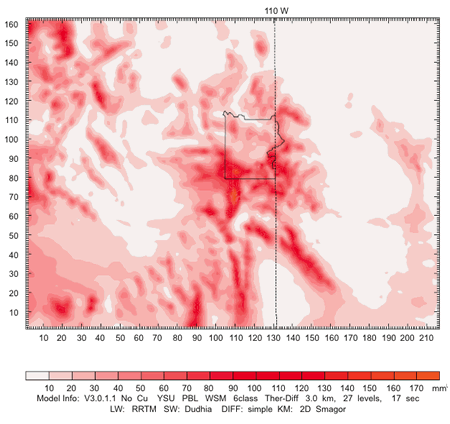
Fig. 73. Total Gulf of Alaska Low storm precipitation for sea-surface temperature = 20°C (68°F). East/west and north/south distances are in number of grid cells, each 3 km (1.86 mi) wide, for a total of 630 km (391 mi) east/west and 480 km (298 mi) north/south. The boundary of Yellowstone National Park is indicated near the center of the domain. The run time was ten days.
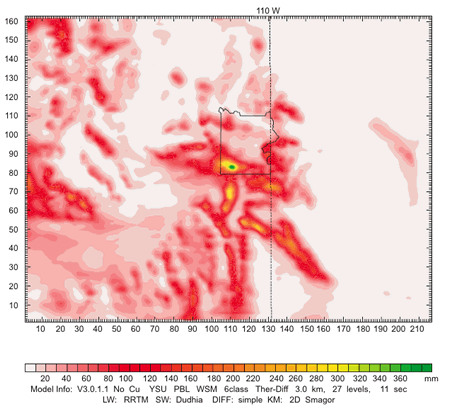
Fig. 74. Total Gulf of Alaska Low storm precipitation for sea-surface temperature = 30°C (86°F). East/west and north/south distances are in number of grid cells, each 3 km (1.86 mi) wide, for a total of 630 km (391 mi) east/west and 480 km (298 mi) north/south. The boundary of Yellowstone National Park is indicated near the center of the domain. The run time was ten days.
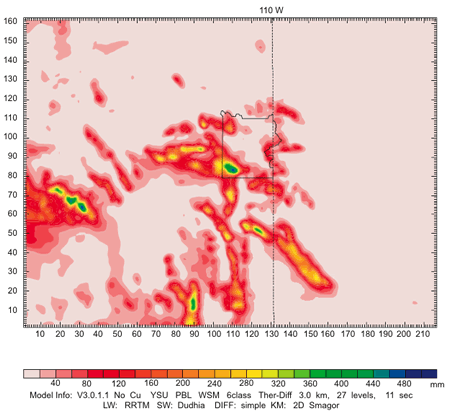
Fig. 75. Total Gulf of Alaska Low storm precipitation for sea-surface temperature = 40°C (104°F). East/west and north/south distances are in number of grid cells, each 3 km (1.86 mi) wide, for a total of 630 km (391 mi) east/west and 480 km (298 mi) north/south. The boundary of Yellowstone National Park is indicated near the center of the domain. The run time was ten days.
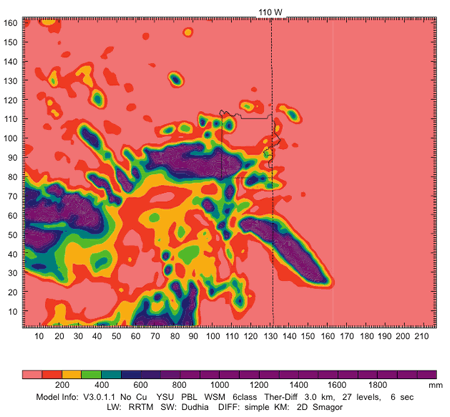
Fig. 76. Total Gulf of Alaska Low storm precipitation for sea-surface temperature = 45°C (113°F). East/west and north/south distances are in number of grid cells, each 3 km (1.86 mi) wide, for a total of 630 km (391 mi) east/west and 480 km (298 mi) north/south. The boundary of Yellowstone National Park is indicated near the center of the domain. The run time was ten days.
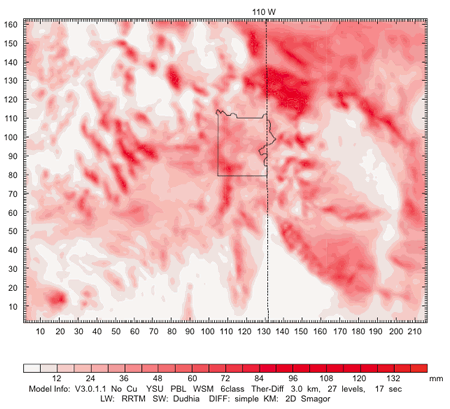
Fig. 77. Total Plunging Western Low storm precipitation for sea-surface temperature = 0°C (32°F). East/west and north/south distances are in number of grid cells, each 3 km (1.86 mi)wide, for a total of 630 km (391 mi) east/west and 480 km (298 mi) north/south. The boundary of Yellowstone National Park is indicated near the center of the domain. The run time was ten days.
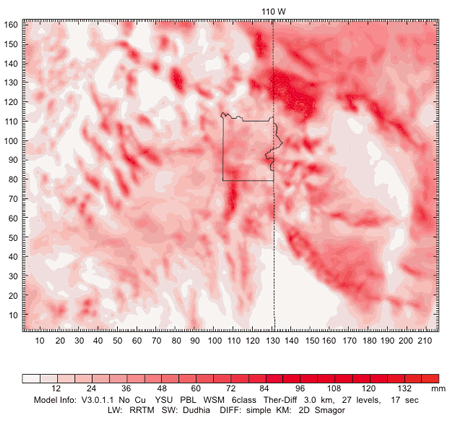
Fig. 78. Total Plunging Western Low storm precipitation for sea-surface temperature = 10°C (50°F). East/west and north/south distances are in number of grid cells, each 3 km (1.86 mi) wide, for a total of 630 km (391 mi) east/west and 480 km (298 mi) north/south. The boundary of Yellowstone National Park is indicated near the center of the domain. The run time was ten days.
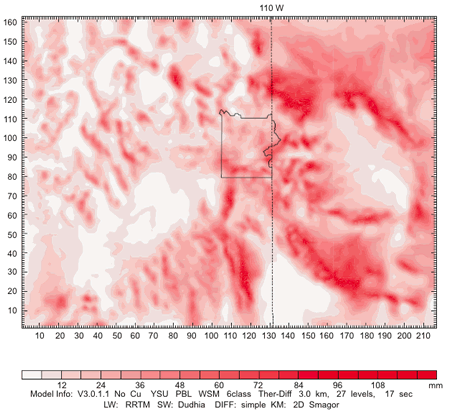
Fig. 79. Total Plunging Western Low storm precipitation for sea-surface temperature = 20°C (68°F). East/west and north/south distances are in number of grid cells, each 3 km (1.86 mi) wide, for a total of 630 km (391 mi) east/west and 480 km (298 mi) north/south. The boundary of Yellowstone National Park is indicated near the center of the domain. The run time was ten days.
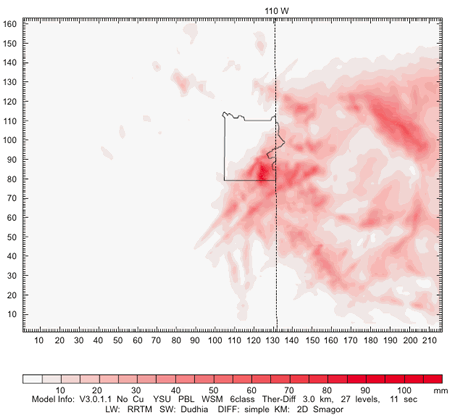
Fig. 80. Total Plunging Western Low storm precipitation for sea-surface temperature = 30°C (86°F). East/west and north/south distances are in number of grid cells, each 3 km (1.86 mi) wide, for a total of 630 km (391 mi) east/west and 480 km (298 mi) north/south. The boundary of Yellowstone National Park is indicated near the center of the domain. The run time was ten days.
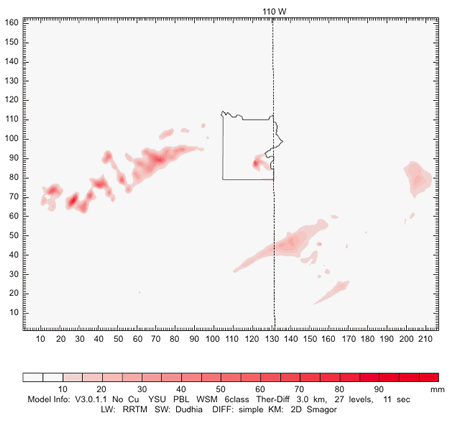
Fig. 81. Total Plunging Western Low storm precipitation for sea-surface temperature = 40°C (104°F). East/west and north/south distances are in number of grid cells, each 3 km (1.86 mi) wide, for a total of 630 km (391 mi) east/west and 480 km (298 mi) north/south. The boundary of Yellowstone National Park is indicated near the center of the domain. The run time was ten days.
According to this logic the accumulated precipitation should be an exponential function of sea-surface temperature if no other processes are operative. Based on the Yosemite National Park results, the accumulated precipitation in Yellowstone National Park should be about six times greater at 45°C (113°F) than at 0°C (32°F), under the same storm conditions. However, in Yellowstone, the complexity of the changing accumulation rate indicates that some other factor is at play. We have suggested earlier that convection over the northern Pacific Ocean and along the West Coast of North America and subsidence over the intermountain region has modified this relationship. Only at the warmest temperatures above about 30°C (86°F), does the exponential vapor pressure effect predominate.
There are several important consequences to these dual driving forces on the accumulation of precipitation during the ice age: (1) storms crossing the coastline and mountain barriers close inland would produce high accumulation rates which are strongly proportional to sea-surface temperature, (2) storms crossing the intermountain region would produce high accumulation rates on mountain barriers for sea-surface temperatures warmer than about 30°C (86°F), (3) accumulation rates on mountain barriers more than a few hundred kilometers inland from the coastline would be reduced somewhat for cooler sea-surface temperatures, and (4) precipitation would be greatly depressed in valleys and on plateaus inland from the coastline and downwind of mountain barriers.
The reduction in precipitation downwind of mountain barriers occurs today along and downwind of the Sierra Nevada and the Rocky Mountains and is known as the rain shadow effect. However, during the ice age this effect would have been even greater. It may have led to the hypothesized ice-free region between the Cordilleran ice sheet along the coastal mountains of British Columbia and the western United States and the Laurentide ice sheet of central Canada. This ice-free corridor has long been believed to have been the path ice age man and animals used to migrate southward on the North American continent from Beringia to Central and South America. These simulations appear to support this view of conditions during a rapid ice age. A low precipitation zone inland from the coastline caused by strong convection over the North Pacific is a new concept.
Detailed discussion of precipitation accumulation
The total precipitation for the smallest domain of the CZF storm is shown in Figs. 65–70 and for the GAL storm in Figs. 71–76 for sea-surface temperatures from 0°C (32°F) to 45°C (113°F). The total precipitation is shown for the PWL storm in Figs. 77–81 only for sea-surface temperatures from 0°C (32°F) to 40°C (104°F) because the simulation at 45°C (113°F) could not be completed. The Pacific Ocean upwind of the North American coast was maintained at a constant sea-surface temperature throughout each of the simulations. Note, in Figs. 65–81, the boundary of Yellowstone National Park is shown in the center of the diagrams as a solid line. The 110° west longitude line (near the eastern border of Park) is shown as a dashed, vertical line near the middle of the diagrams. The distance scales of the diagrams are shown in the number of grid cells (each 3 km [10,000 ft] wide) along the horizontal and vertical axes.
The continental divide at the crest of the Rocky Mountains runs southeast to northwest from Colorado to Canada across the southeast corner of Yellowstone National Park through the center of its western boundary. The continental divide running through Yellowstone National Park includes mountain peaks to over 4.25 km (14,000 ft) in Colorado, the Great Divide Basin low region at about 2.45 km (8,000 ft) in southwestern Wyoming, peaks to almost 4.25 km (14,000 ft) in the Wind River Range to the southeast of Yellowstone, the Grand Tetons to over 4 km (13,000 ft) directly south of Yellowstone, several peaks within Yellowstone to over 3 km (10,000 ft), and peaks northwestward of Yellowstone through Montana and Canada to over 3 km (10,000 ft). The Absaroka mountain range parallels the southeast/northwest trending continental divide on the east side of Yellowstone. East of the Absarokas the terrain drops off into the Great Plains descending slowly to about 0.6 km (2,000 ft) elevation in Nebraska and the Dakotas.
About 160 km (100 mi) west of Yellowstone are two southeast/northwest trending mountain chains, the Wasatch Range in Utah and the Bitterroot Range in Montana. Mountain peaks to over 3 km (10,000 ft) are present in both ranges. Between these two ranges and southwest of Yellowstone lies the Snake River Plain at an elevation of about 1.5 km (5,000 ft). This low elevation plain, believed to have been formed when the volcanic hotspot currently under Yellowstone National Park down-warped southern Idaho, provides an opening in the Wasatch/Bitterroot mountain barrier for air to flow from the southwest into the Park unobstructed and to precipitate large quantities of snow under the right conditions. Farther west are a series of about a dozen south-south-west to north-north-east mountain chains in Nevada. These 0.6 km (2,000 ft) to 1.5 km (5,000 ft) high mountains rest on the Great Basin which has an average elevation of about 1.2 km (4,000 ft). The Sierra Nevada with an elevation of 2.4 km (8,000 ft) to 3.7 km (12,000 ft) and a few peaks to over 4 km (13,000 ft) lie about 375 km (600 mi) southwest of Yellowstone. The Sierra Nevada is extremely important in the production of precipitation inland on the continent because it removes a large percentage of the precipitable water in storms before they reach Yellowstone.
Precipitation for the CZF storm varied from a minimum of less than 10 mm (~½ in) in the valleys of Idaho upwind of Yellowstone National Park and central and northwestern Wyoming east of east of the Park for a sea-surface temperature = 0°C (32°F) to a maximum of over 1,700 mm (~70 in) along the continental divide in the Wind River Range southeast of the Park and in the southern part of the Park and west outside the Park for a sea-surface temperature = 45°C (113°F). For the warmer sea-surface temperatures precipitation in the mountains was dramatically greater than over the lower elevations.
Precipitation for the GAL storm exhibited similar patterns of precipitation versus sea-surface temperature as the CZF storm. It likewise had a minimum of less than 10 mm (~½ in) in the valleys of Idaho upwind of Yellowstone National Park and central and northwestern Wyoming east of the Park for a sea-surface temperature = 0°C (32°F). Precipitation reached a maximum of over 1,800 mm (~71 in) along the continental divide in the Wind River Range southeast of the Park, in the southern part of the Park, and west outside the Park for a sea-surface temperature = 45°C (113°F). For the warmer sea-surface temperatures precipitation in the mountains was also dramatically greater than over the lower elevations.
The PWL storm exhibited a considerably different precipitation pattern compared with the other two storms. It varied from a minimum of less than 5 mm (~¼ in) in the valleys of Idaho upwind and south of Yellowstone National Park and in the lower elevations of Wyoming south and east of the Park to a maximum of over 132 mm (~5 in) in the Beartooth and Bighorn Mountains to the northeast of the Park for a sea-surface temperature = 0°C (32°F). The precipitation coverage and amount was less for warmer sea-surface temperatures over the entire region. The maximum amount decreased to less than 100 mm (~4 in) for the warmest sea-surface temperature which was able to be completed of sea-surface temperature = 40°C (104°F).
The CZF and GAL storms tended to produce widespread precipitation over the entire Yellowstone National Park region, but with somewhat heavier precipitation over the mountains to the west and north of the Park. As the sea-surface temperature was increased for these cases, precipitation increased more in the mountains than at lower elevations. The PWL storm also produced widespread precipitation over the entire region, but with heavier precipitation over the mountains to the north and northeast of the Park. The magnitude of precipitation for the PWL storm was about a factor of ten less than for the CZF and GAL storms. As the sea-surface temperature was increased for this storm precipitation actually declined over the entire region with almost no precipitation west of Yellowstone at sea-surface temperature = 40°C (104°F). It is unclear why this storm acted so differently than the other two. These results seem anomalous and should probably not be trusted. Possibly storm dynamics and the speed of movement were affected by warm sea-surface temperatures.
Table 4 shows the total storm precipitation as a function of storm, sea-surface temperature, and location for the three simulated cases. The total storm precipitation for the CZF case increased from about 310 mm (12 in) in the western mountains for the actual storm to about 1700 mm (68 in) at 45°C (113°F) and from about 230 mm (9 in) to about 1700 mm (68 in) in the eastern mountains. This was an increase by a factor of between 5.5 and 7.4 as the sea-surface temperature increased to the maximum simulated sea-surface temperature. The total valley precipitation increased from about 0 mm in the actual storm to about 100 mm (4 in) for a sea-surface temperature of 45°C (113°F).
The total storm precipitation for the GAL case increased from about 170 mm (7 in) for the actual storm to about 1,800 mm (72 in) at 45°C (113°F) in the western mountains and from about 120 mm (4.8 in) to 1800 mm (72 in) in the eastern mountains. This was an increase by a factor of between about 10 and 15 as the sea-surface temperature increased to the maximum simulated sea-surface temperature. The total valley precipitation increased from about 0 mm in the actual storm to about 100 mm (4 in) for a sea-surface temperature of 45°C (113°F).
The total storm precipitation in the western mountains for the PWL case decreased from about 84 mm (3.5 in) for the actual storm to about 70 mm (3 in) at 40°C (104°F) and from about 120 mm (4.8 in) to 50 mm (2 in) in the eastern mountains. This was a decrease of between about 15% and 60% as the sea-surface temperature increased to the maximum simulated sea-surface temperature of 40°C (104°F). The total valley precipitation didn’t change from about 0 mm.
Precipitation along a 45° southwest to northeast line through Yellowstone Lake Lodge
Fig. 82 shows the three model domains with a 45° southwest northeast line centered on Yellowstone Lake Lodge in Yellowstone National Park. The 45° line is generally parallel to the mid-level flow of air over the mountains in many storms, although the flow is more southerly near the surface and more westerly aloft. The 45° line runs from the southwestern United States in the Sierra Nevada, across Nevada, and Idaho, to the center of Yellowstone National Park, across Montana, and into Manitoba, Canada near Winnipeg.
Figs. 83, 84, and 85 show the precipitation for the mid-size domain for the CZF, GAL, and PWL storms, respectively, from southwest to northeast along the 45° line as a function of sea-surface temperature.
Table 4. Storm precipitation as a function of storm, sea-surface temperature, and location.
| Sea-Surface Temperature (°C) | Western Mountain Precipitation (mm) | Western Valley Precipitation (mm) | Eastern Mountain Precipitation (mm) | Eastern Valley Precipitation (mm) |
|---|---|---|---|---|
| Continuous Zonal Flow | ||||
| 0 | 320 | 0 | 200 | 0 |
| 7* | 310 | 0 | 230 | 0 |
| 10 | 300 | 0 | 250 | 0 |
| 20 | 400 | 20 | 300 | 20 |
| 30 | 300 | 10 | 250 | 10 |
| 40 | 900 | 40 | 700 | 40 |
| 45 | 1700 | 100 | 1700 | 100 |
| Gulf of Alaska Low | ||||
| 0 | 200 | 0 | 140 | 0 |
| 10 | 200 | 0 | 140 | 0 |
| 12* | 170 | 0 | 120 | 0 |
| 20 | 150 | 0 | 90 | 0 |
| 30 | 350 | 10 | 250 | 10 |
| 40 | 450 | 20 | 300 | 20 |
| 45 | 1800 | 100 | 1800 | 100 |
| Plunging Western Low | ||||
| 0 | 90 | 0 | 132 | 0 |
| 10 | 90 | 0 | 132 | 0 |
| 17* | 84 | 0 | 120 | 0 |
| 20 | 80 | 0 | 108 | 0 |
| 30 | 80 | 0 | 70 | 0 |
| 40 | 70 | 0 | 50 | 0 |
| * Observed sea-surface temperature for WRF validation calculations | ||||
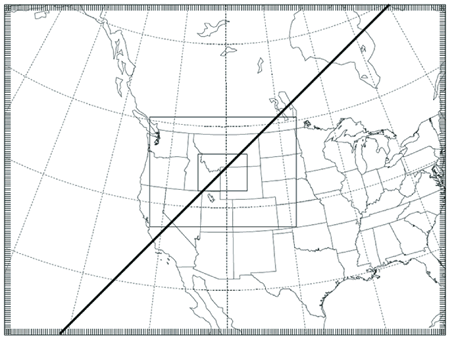
Fig. 82. The three model domains with a 45° line from southwest to northeast centered on Yellowstone Lake Lodge.
The main peaks of precipitation in Figs. 83–85 from southwest to northeast in the CZF, GAL, and PWL storms are caused by the orographic uplift over the Sierra Nevada in Eastern California; the high country of the Toiyabe, Toquima, and Monitor Ranges in central Nevada; the Wasatch Range in northern Utah; the Tetons and the continental divide in Yellowstone National Park; the Beartooth Mountains northeast of the Park; and the Bull Mountains near Billings, Montana. In the northern Great Plains to the northeast of Yellowstone the precipitation is much less than in the mountains to the west of Yellowstone. The CZF and GAL storms have similar magnitudes of precipitation over the various mountain ranges, but the PWL storm is much smaller.
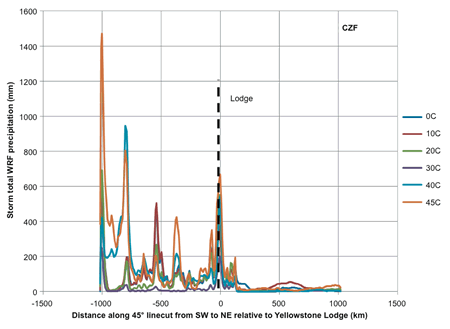
Fig. 83. Precipitation for the Continuous Zonal Flow storm from southwest to northeast along a 45° line centered on Yellowstone Lake Lodge as a function of sea-surface temperature °C.
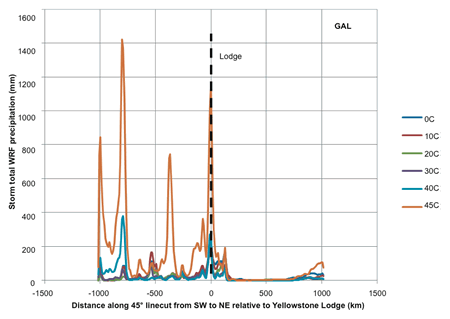
Fig. 84. Precipitation for the Gulf of Alaska Low storm from southwest to northeast along a 45° line centered on Yellowstone Lake Lodge as a function of sea-surface temperature °C.
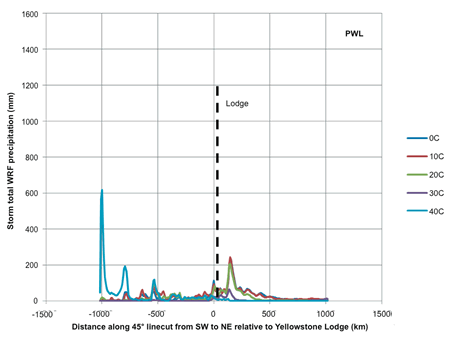
Fig. 85. Precipitation for the Plunging Western Low storm from southwest to northeast along a 45° line centered on Yellowstone Lake Lodge as a function of sea-surface temperature °C.
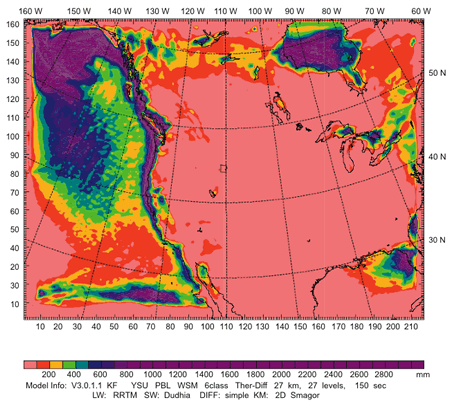
Fig. 86. Total Continuous Zonal Flow storm precipitation for sea-surface temperature = 30°C (86°F) on the largest domain. Note the location of Yellowstone National Park at approximately 110°W and 45°N. East/west and north/ south distances are in number of grid cells, each 27 km (16.8 mi) wide, for a total of 5,670 km (3,523 mi) east/west and 4,320 km (2,684 mi) north/south. The run time was ten days.
Notice that the precipitation increases with sea-surface temperature over each of the mountain ridges. It also increases more strongly at higher temperatures. Between the mountain ridges the precipitation remains relatively low, particularly over the deserts of Nevada and Utah and the Great Plains. However, over the Pacific Ocean off the coast of California the precipitation increases strongly with sea-surface temperature. Fig. 86 shows an example of the heavy precipitation which occurs over the ocean and along the West Coast of the United States at 30°C (86°F) for the CZF case. This heavy precipitation is thought to be due to instability over the warm ocean producing convection. The instability appears to cause general lifting over the ocean and along the coast and a tendency for subsidence farther inland with decreased precipitation at warmer sea-surface temperatures.
The larger peaks in precipitation over the mountain ranges and relatively lower precipitation amounts in the valleys at warmer temperatures implies that the orographic influence is stronger than the general synoptic-scale lifting of the air as sea-surface temperature is increased. This supports the idea of lifting over the ocean and subsidence over the continent. Warm sea-surface temperatures not only provide increased moisture for precipitation processes, but also affect the storm dynamics.
Increased glacier growth
This study has shown that precipitation can be increased by at least a factor of 4 during the presence of CZF and GAL types of storms in Yellowstone National Park if the sea-surface temperature of the Pacific Ocean is above about 30°C (86°F). Since the CZF type of storm occurs most frequently and contributes the largest accumulation of precipitation on the mountains of the intermountain region, we will emphasize the impacts of this type of storm. The PWL type of storm occurs relatively infrequently, contributes only about 10% as much to the accumulation of precipitation as the other two types, and exhibits possible anomalous behavior. Such a large increase in precipitation would readily lead to larger, more permanent glaciers if the precipitation continued to accumulate from one year to another. Unlike the storms in Yosemite National Park close to the coastline reported by Vardiman and Brewer (2010a, 2010b), these storms in Yellowstone National Park in the intermountain region farther from the coastline accumulate most of their precipitation on the mountain barriers at relatively warm sea-surface temperatures.
This study considered the characteristics of colder storms coming from the west and northwest associated with a trough near the west coast of the United States during ice age conditions. Crowley and North (1991) have shown that the path of the jet stream was positioned much further south during the ice age—crossing from the Pacific Ocean onto the North American continent near San Francisco. Such a position would have caused the frequency of storms crossing the Sierra Nevada to be increased greatly, probably more than doubling the number of storms which dumped rain and snow each winter over the intermountain region of the Northwest. Furthermore, the storms would probably have been colder due to polar air being displaced farther south. And, the winter season would have been extended into the summer lengthening the winter season and reducing or eliminating the melting of glaciers between seasons.
Multiplying these two effects together—the increase in precipitation due to warmer sea-surface temperatures and the greater frequency of cold storms—it is likely that the snowfall in the Yellowstone National Park and the intermountain region in general from this type of storm, would have been at least eight times greater than what it is today (four times or more precipitation per storm and two times as many storms). It is also likely that less glacial melting would have occurred in the summer due to the extended winter season.
An estimate will be made here of the increased precipitation due to the CZF type of storm. Fig. 84 shows that a CZF type of storm accumulates a total of between 100 mm (4 in) and 1,000 mm (40 in) of water equivalent as ice per week depending upon sea-surface temperature. It is possible to calculate the depth of glaciers that will accumulate in Yellowstone National Park if no melting occurs in the summers. For example, a storm that precipitates 1,000 mm (40 in) will contribute about 1 m (3.3 ft) of ice to a glacier. Snow would be five to ten times deeper, but it would be compressed to the density of ice over time. The glacier thickness calculated here will be for ice. Ice has approximately the same density as water (differing only by about 10%). If only one CZF short wave (as opposed to multiple short waves which made up a storm in the simulations) precipitated 250 mm (10 in) each year without melting, the glacier would be about 25 m (82 ft) thick in 100 years. An estimate of 250 mm (10 in) per storm is a low estimate based on the simulations done in this study.
CZF types of storms are the most frequent storms which affect the Yellowstone National Park region. Today, about 20 CZF short waves affect Yellowstone during an average year. The range in frequency is between about ten short waves during a dry year to 30 or more during a wet year. Assuming the average number of short waves is doubled to 40 short waves, because the jet stream was positioned farther south over San Francisco during the ice age, and each short wave precipitated 250 mm (10 in) (since a typical short wave only lasts about 2.5 days—not a week), then the glacier would grow to over 1 km (3,300 ft) thick in 100 years. This was about the thickness of the Yellowstone ice cap during the ice age.
Fig. 87 shows glacier depth as a function of precipitation rate and frequency of storms in Yellowstone National Park. Notice that glacier thickness is a function of precipitation rate, frequency of short waves, and the length of an ice age. The blue oval in Fig. 87 represents a region of average conditions which could have occurred during an ice age with a warm ocean. Since precipitation rate is a function of sea-surface temperature and storm frequency is a function of the location of the jet stream, it appears that the presence of glaciers in Yellowstone National Park during an ice age can easily be explained by warm sea-surface temperatures and a more southerly position of the jet stream. Some melting of the glaciers may have occurred between seasons depending on the length of the summers, but glaciers could have easily exceeded 1 km (3,300 ft) in depth. The typical calculated glacier depth after 100 years was found to be 1 km (3,300 ft) in Yellowstone versus 1.1 km (3,500 ft) calculated for Yosemite National Park, which is closer to the coastline.
Conclusions
Three types of cold, winter storms in Yellowstone National Park have been simulated and reported —Continuous Zonal Flow (CZF), Gulf of Alaska (GAL), and Plunging Westerly Low (PWL) types of storms. Numerical simulations of warm sea-surface temperatures in the northeastern Pacific Ocean were conducted to find how much precipitation in Yellowstone National Park would have been increased for warm sea-surface temperatures. Sea-surface temperatures warmer than 30°C (86°) increased precipitation from all three types of storms in Yellowstone National Park and throughout the mountains of the Pacific Northwest region by a factor of at least four. When the frequency of short waves was doubled due to the more southerly position of the jet stream during the ice age the mountain precipitation increased by a factor of eight.
Precipitation in the intermountain valleys and plateaus decreased significantly in the simulations, magnifying the difference in precipitation between the mountains and the valleys. This “rain shadow” effect not only occurred downwind of mountain barriers, but also within several hundred kilometers of the coastline. The cause for reduced precipitation inland at warmer temperatures was hypothesized to be the removal of precipitable water by upwind mountain ranges and increased convection and rising motions over the ocean with descending motions inland. These model results support the theory that an ice-free zone extended from north to south in western Canada and the northwestern United States separating the Cordilleran and Laurentide ice sheets and allowing ice age immigration from Beringia to Central and South America. The difference from the conventional theory is that this happened in just a few hundred years after the Genesis Flood because of the extreme precipitation rates caused by the warm oceans.
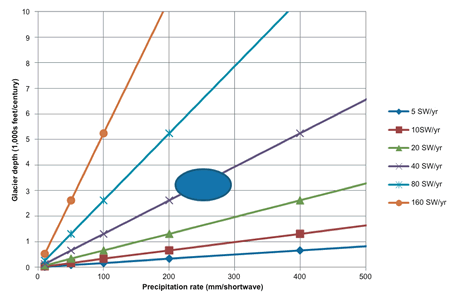
Fig. 87. Glacier depth as a function of precipitation rate and short wave frequency in Yellowstone National Park. The blue dot represents a probable glacier depth of about 1km (3,300 ft) after a century of accumulation, given more precipitation per short wave for warm sea-surface temperatures and increased short wave frequencies due to a more southerly jet stream during the ice age. The colored lines represent the number of short waves per year affecting Yellowstone National Park.
Glaciers over a kilometer thick (3,300 ft) could have readily developed in the mountains in and around Yellowstone National Park during hundreds of years following the Genesis Flood. Glaciers filled the basin of Yellowstone Lake, topped many of the mountains, and flowed down the canyons and valleys in and around Yellowstone. The glaciers in Yellowstone were estimated to be on the order of 1 km (3,300 ft) thick for sea-surface temperatures warmer than 30°C (86°F) over a period of a century. This is slightly less than the estimate of 1.1 km (3,500 ft) for the same period in Yosemite National Park reported earlier by the authors. The difference is hypothesized to be due to the descending motions inland from the coastline caused by convection over the ocean. Yosemite National Park is located in the Sierra Nevada closer to the coastline and was less influenced by these descending motions.
Recommendations
The vertical circulations hypothesized in this paper should be confirmed by analyzing the three dimensional data available in the simulations. Rising motions over the ocean and descending motions inland should be quantified and related to rates of precipitation production over the mountains and the valleys. It would also be valuable to quantify the dimensions and magnitude of the circulation relative to the coastline.
One of the reviewers also suggested that the effect of a reduction in solar radiation should also be simulated for ice age conditions. It is well known that during the ice age more volcanic aerosols were present in the atmosphere and reflection of solar radiation back to space would result in less summer melting of the ice sheets. This would be expected to greatly increase the accumulation of snow due to carryover of the snow pack from year to year.
Acknowledgments
The mesoscale model (WRF) used in this study was developed and maintained by the National Center for Atmospheric Research (NCAR) available at http://www.wrf-model.org/index.php. The meteorological and topographic data (NARR) used in this study were provided by the National Oceanographic and Atmospheric Administration (NOAA) National Operational Model Archive & Distribution System available online at http://www.emc.ncep.noaa.gov/mmb/rreanl/. Richard Carpenter and Brent Shaw of Weather Decision Technologies, Inc., and Valentine Anantharaj and Xingang Fan of Mississippi State University offered occasional assistance in the use of WRF. We appreciate the reviewers for correcting the manuscript and offering improvements. This research was funded by the National Creation Research Foundation of the Institute for Creation Research.
References
Crowley, T. J. and G. R. North. 1991. Paleoclimatology. Oxford Monographs on Geology and Geophysics, No. 18, pp. 71–91. New York: Oxford University Press.
NCAR. 2003. MM5 model, retrieved from http://www.mmm.ucar.edu/mm5/.
NCAR. 2007. WRF model, retrieved from http://www.wrf-model.org/index.php.
Pierce, K. L. 1979. History and dynamics of glaciation in the northern Yellowstone National Park area. U.S. Geological Survey Professional Paper 729 F, 91 p.
Vardiman, L. 2008. A proposed mesoscale simulation of precipitation in Yosemite National Park with a warm ocean. In Proceedings of the Sixth International Conference on Creationism, ed. A. A. Snelling, pp. 307–319. Pittsburgh Pennsylvania: Creation Science Fellowship; Dallas, Texas: Institute for Creation Research.
Vardiman, L. and W. Brewer. 2010a. Numerical simulation of precipitation in Yosemite National Park with a warm ocean: A Pineapple Express Case Study. Answers Research Journal 3:23–36. Retrieved from www.answersingenesis.org/contents/379/arj/v3/numerical_simulation_precipitation_Yosemite.pdf.
Vardiman, L. and W. Brewer. 2010b. Numerical simulation of precipitation in Yosemite National Park with a warm ocean: Deep Upper Low and Rex Blocking Pattern case studies. Answers Research Journal 4:119–145. Retrieved from www.answersingenesis.org/contents/379/arj/v3/numerical_simulation_precipitation_YosemiteII.pdf.
