

The views expressed in this paper are those of the writer(s) and are not necessarily those of the ARJ Editor or Answers in Genesis.
Abstract
The purpose of this paper is to give a description of the overall petrology of the Permian Coconino Sandstone that outcrops prominently in Arizona, including the Grand Canyon. The Coconino is often regarded as something like a “type” of the many similar Permian cross-bedded sandstones that occur around the world. It is generally accepted that the Coconino is an eolian sandstone and that its sand grains are well-sorted and well-rounded. However, until now, no detailed petrographic work has ever been published to substantiate these assumptions. We widely sampled the thickness and lateral extent of the formation and then studied hundreds of thin sections from these outcrops. Thin section study revealed that the Coconino is moderately to poorly sorted and contains sub-angular to sub-rounded sand throughout. We also report the surprising and widespread occurrence of mica, angular K-feldspars, dolomite ooids, dolomite clasts, dolomite cements, and bedded dolomite within the formation. In the few other Permian sandstones that we have sampled in North America and Europe, similar trends were found. In general, these are not characteristics that are typically thought of as associated with modern eolian sand deposits. In light of these new data, alternative depositional models for the Coconino should be considered.
Keywords: Coconino Sandstone, sand waves, sandstone petrology, dolomite ooids, muscovite, compaction of sandstone, large cross-beds, high angle cross-beds, Grand Canyon, frosting, rounding
Introduction
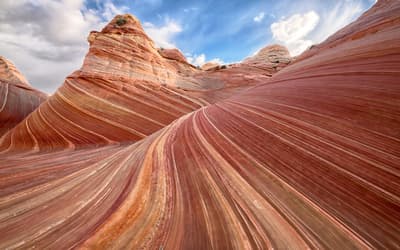
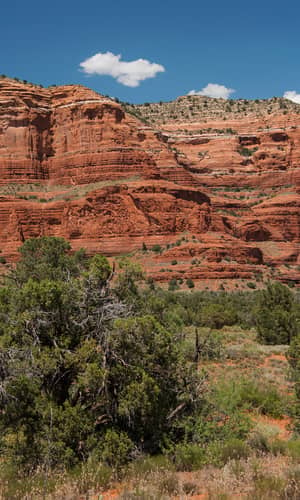
It has been eight decades since the eminent Grand Canyon geologist Edwin McKee published his monograph on the Coconino Sandstone (1934). This was the first of many scientific manuscripts McKee published on the geology of the Grand Canyon. Since then, the Coconino has become the classic example of an ancient eolian sandstone. However, no further comprehensive studies have been undertaken to further analyze the petrology of this distinctive unit with the important exception of Lundy’s (1973) little known thesis. The formation is displayed prominently in areas like the Grand Canyon (Fig. 1) and Sedona and is known for its quartz purity and large planar-tabular cross-beds (Fig. 2). It is similar in character to many of the other Permian sandstones of this period (McKee 1979). It has long been recognized that the Coconino grades laterally into the Glorieta Sandstone of New Mexico, which grades into the Lyons Sandstone of Colorado (Brill 1952; Dimelow 1972). Although slightly older, our preliminary field and laboratory investigations show the Tensleep Sandstone of Wyoming is similar in outward character and thin section petrography to the Coconino.
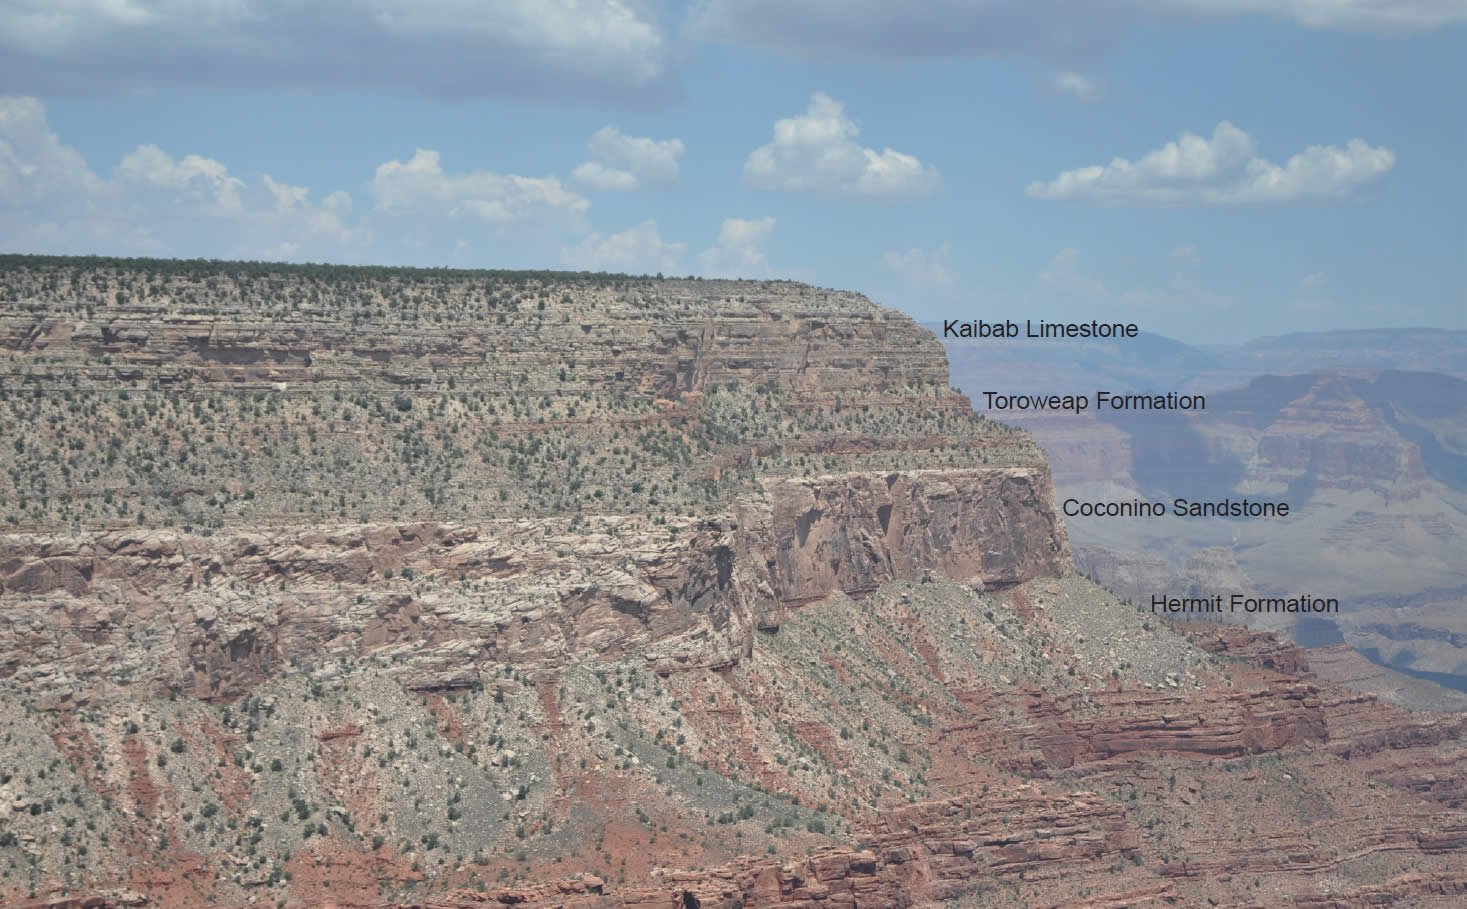
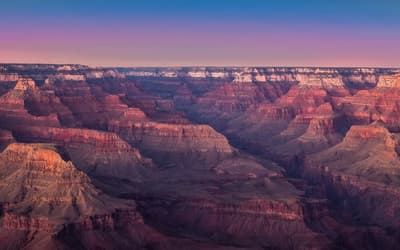
Fig. 1. The Permian strata in the Grand Canyon, including the Coconino Sandstone. Photo taken looking west along Hermit Trail.
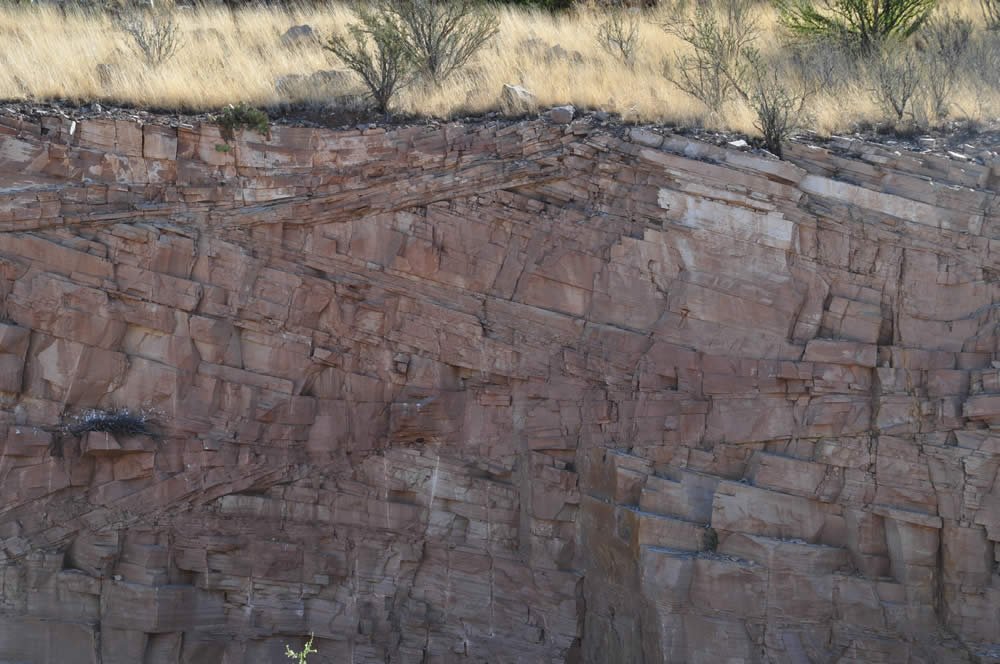
Fig. 2. The Coconino Sandstone is characterized by large cross-beds, some of which have foresets of 50 m (164ft) in length. The cliff face is about 7 m (22.9 ft) high. Photo taken near Ash Fork, Arizona.
Since McKee’s original publication, much progress has been made in quality thin section production techniques. Advances have also been made in analyzing those thin sections for properties such as grain size, sorting and rounding, and evaluating the data statistically. In this paper we report the results of our study of hundreds of thin sections from outcrops throughout the thickness and breadth of the formation. Thus, we are now able to better characterize the petrology of the Coconino through its entire thickness and lateral extent.
Beginning with McKee, most authors have used terms like “uniformity of grain size,” “well-sorted,” and “well-rounded” to characterize the Coconino; textural features often cited as characteristics of modern wind-blown sands. For example, Middleton, Elliott, and Morales (2003, p. 171) state: “The Coconino is composed of fine-grained, well-sorted, and rounded quartz grains and minor amounts of potassium feldspar.” As we began this study that is what we expected to find, for most of these characteristics seem to be apparent when using a hand lens to make precursory observations. However, with detailed thin section study we have found very few places in the Coconino that can be classified as “well-sorted” or “well-rounded.” Instead, our detailed petrographic analysis shows that the Coconino is better characterized as being moderately to poorly sorted and consisting of sub-angular to sub-rounded grains. Additionally, we found some surprising accessory minerals within the sandstone such as mica, angular feldspars, and dolomite.
It is important to realize that many have based their eolian interpretation of the Coconino on its assumed petrographic characteristics and the similarity of those characteristics to modern eolian deposits. It is the aim of this paper to thoroughly describe the petrology of the Coconino and show that its petrology is not what many have envisioned. We believe that petrographic assumptions have led to incorrect depositional models for the formation. Because of this new information, we believe it is time to reconsider the depositional environment of this formation.
Methods
The Coconino Sandstone was sampled widely where it outcrops throughout Arizona and extreme southern Utah (Fig. 3). Permits were obtained to do some limited collecting within Grand Canyon National Park (GRCA-2005-SCI-0011 and GRCA-2010-SCI-0039). Thin sections were made at Calgary Rock and Materials Services Inc., Calgary, Alberta. Standard procedures were used including impregnation of the rock with blue-dyed epoxy, grinding thin sections to 30 μm, and staining with double carbonate stain (potassium ferricyanide and alizarin red s) and sodium cobaltinitrite to reveal the presence of calcite, dolomite, and K-feldspar. X-ray diffraction (XRD) analysis was completed on some of the samples to confirm the presence of various minerals such as dolomite.
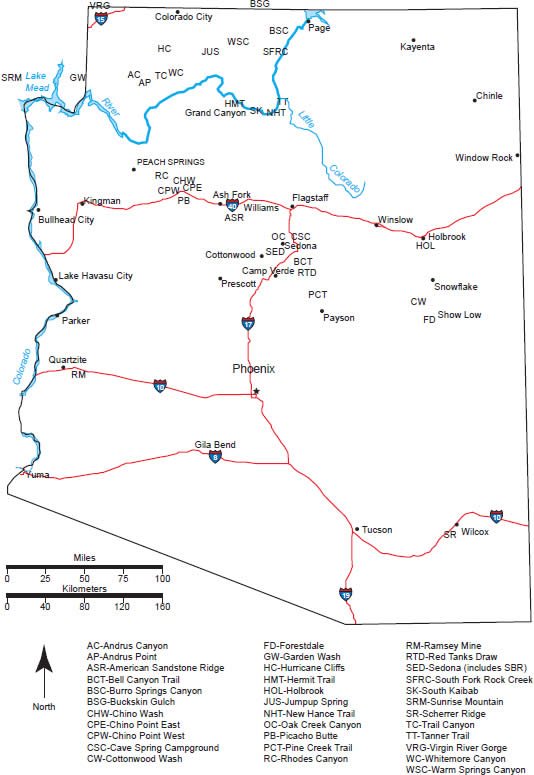
Fig. 3. Outcrop location map of the Coconino Sandstone in Arizona. Over 400 thin sections were cut for this study; approximately 100 were analyzed in detail for the results in this manuscript.
The material was studied using a Nikon Eclipse 50i Pol microscope equipped with the Br software package making measuring and tabulating grain size statistics relatively easy. Measurements were made directly on a computer screen and then saved to a spreadsheet. Typically the long axes of 400–600 sand grains were measured on each slide. When grains were partially obscured because they were on the edge of the field of view, they were ignored. Grains within the field of view were only measured when the grain boundaries were evident. Care was taken to measure the grains within the “dust rims” of quartz (dust rims delineate the detrital grain from subsequent secondary cements). All detrital grains were measured; the vast majority of which were quartz, chert, and K-feldspar.
Every grain was measured in 5 to 10 systematically selected “fields of view” from each slide, perpendicular to bedding. The full width or length of each slide was always counted to get a representative sample of all the grains present in the thin section. Most measurements were made with the 10× microscope objective, unless the grain size was exceptionally large, then the 4× objective was used. In each case, the goal was to measure in excess of 400 grains covering the entire thickness of the rock on the slide, perpendicular to bedding. Sometimes this could be accomplished with five “fields of view” and other times it was necessary to count ten or more. Using these methods, typically about 40–120 grains could be counted (per field of view), depending on grain size. Overall statistics for a particular outcrop were calculated by selecting 300 random grains from each thin section from an outcrop (i.e., a site with ten thin sections would be represented by 3000 grains).
Standard grain size categories were used when describing grains: coarse silt, 5 to 6 Φ; very coarse silt, 4 to 5 Φ; very fine sand, 3 to 4 Φ; fine sand, 2 to 3 Φ; medium sand, 1 to 2 Φ; coarse sand, 0 to 1 Φ; very coarse sand, −1 to 0 Φ; where Φ = −log2d, d being the particle diameter in millimeters.
Mean, mode, d50, and standard deviation were calculated for each thin section and each outcrop. Using Johnson’s (1994) suggestion for sorting (based on the standard deviation of the Φ size using long axis measurements of grains in thin section), the sorting of each slide and the sorting of each overall outcrop was calculated (for thin sections, <0.45 Φ is very well-sorted; 0.45–0.55 Φ is well-sorted; 0.55–0.70 Φ is moderately sorted; 0.70–0.90 Φ is poorly sorted; and >0.90 Φ is very poorly sorted). Note that all of the measurements that we are reporting are “uncorrected.” No attempt was made to convert the measurements to actual grain size. Johnson (1994) suggests that this can be done by adding 0.05 to the Φ size; it turns out that long axis measurements are fairly close to uncorrected long axis measurements of the grains in thin section. “Uncorrected” numbers will yield the same standard deviation (sorting) as corrected ones will.
When examining each thin section, rounding was estimated for the overall thin section (mostly quartz) and K-feldspar using the ρ scale by Powers (1953) modified by Folk (1955): “0” being the most angular and “6” being perfectly spherical. Care was taken to look at the quartz grains inside the “dust rims” when determining rounding. At least one thin section from each locality was point counted with a grid that was superimposed on the computer screen. Point counting was carried out to determine overall mineral composition, cements, and porosity. Depending on how the grid was centered, it usually contained 315 points. Microscope software facilitated tabulation of each point on the grid. Point counting is time consuming, so after at least one slide from a location was counted, the rest of the slides were estimated, comparing them to the point counted slide and XRD analysis, if available. Minerals present in small percentages (such as mica) were noted as occurring as trace (t) minerals.
We selected several representative samples of the Coconino for SEM analysis from the CPW, CSC, and PCT locations. The work was performed by Ray Strom at Calgary Rock and Materials Services Inc., in Calgary, Alberta. In particular, we wanted to examine “frosting” that is common on Coconino sand grains. We also examined a sample of poorly lithified Coconino (CSC-5) under a light microscope. The sample was rinsed and stirred in a weak HCl bath for about 10 minutes and then rinsed with water and dried for examination at 40×.
For the characterization of modern dune sand, we used Ahlbrandt’s (1979) textural sieve data from 465 modern dunes and our sieve data from 54 dunes to plot mean grain size versus sorting for 519 dune samples. Samples were collected from a wide variety of dune types, sizes, and shapes from all over the world. Interdune samples were not used because they are typically poorly sorted. Confidence intervals (75, 90, 95, and 99%) were calculated and plotted with the “R” statistical package. We plotted these data to get an idea of the sorting parameters of modern eolian dunes for comparison with the Coconino (Fig. 4).
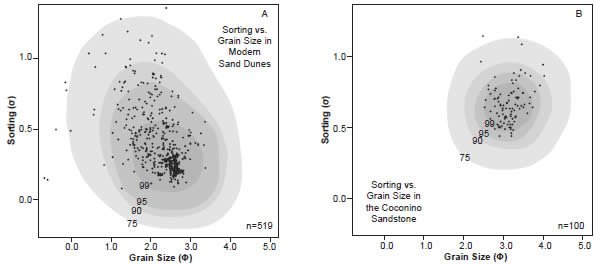
Fig. 4. A. Grain size versus sorting for modern sand dunes. The plot consists of two sets of data: 465 samples from Ahlbrandt (1979) and 54 samples sieved by Whitmore and his students for a total of 519 samples. Ahlbrandt’s samples were sieved with ¼ Φ sieves and Whitmore’s data was prepared with ½ Φ sieves. All points are from sand dunes (not interdunes, beaches, etc.). The plot was made with the “R” statistical package and shows the 75, 90, 95, and 99% confidence intervals (R Development Core Team 2011).
B. Grain size versus sorting for the Coconino Sandstone. Data can be found in Table 1. Compare this plot with A, a plot of the sorting versus grain size of modern dunes. In modern dunes, sand of the same mean grain size of the Coconino is much better sorted. The plot was made with the “R” statistical package (R Development Core Team 2011) and shows the 75, 90, 95 and 99% confidence intervals.
Location |
Latitude (degrees) |
Longitude (degrees) |
Number of grains measured |
Mean grain size (Φ) |
Mode (Φ) |
d50 (Φ) |
Std Dev (Φ) |
Sorting |
Rounding score for thin section (0 to 6) |
Rounding score for K-feldspar (0 to 6) |
Counted (c) or estimated (e)? |
Quartz |
Chert |
K-feldspar |
Plagioclase |
Kaolinite |
Mica |
Other |
Brown |
Zircons (usually well-rounded) |
Black opaque minerals (usually well-rounded) |
Dolomite (clasts, cement, rhombs, ooids) |
|---|---|---|---|---|---|---|---|---|---|---|---|---|---|---|---|---|---|---|---|---|---|---|
American Sandstone Ridge |
||||||||||||||||||||||
ASR-06 |
35.04072 |
112.28378 |
|
|
|
|
|
|
|
|
|
|
|
|
|
|
|
|
|
|
|
y |
ASR-07 |
35.04072 |
112.28378 |
611 |
3.15 |
3.00, |
3.08 |
0.63 |
moderately sorted |
3.5 |
3.5 |
e |
79 |
15 |
6 |
t |
t |
t |
t |
t |
t |
t |
n |
ASR-09 |
35.04072 |
112.28378 |
533 |
3.66 |
4.00 |
3.70 |
0.71 |
poorly sorted |
3.0 |
2.5 |
e |
68 |
17 |
15 |
0 |
0 |
t |
t |
t |
t |
t |
n |
ASR-10 |
35.04072 |
112.28378 |
522 |
2.66 |
2.75 |
2.69 |
0.56 |
moderately sorted |
3.5 |
3.5 |
e |
70 |
18 |
12 |
0 |
0 |
t |
t |
0 |
t |
t |
n |
ASR-11 |
35.04072 |
112.28378 |
676 |
3.25 |
3.00 |
3.15 |
0.75 |
poorly sorted |
3.0 |
3.5 |
e |
74 |
17 |
9 |
0 |
0 |
t |
t |
t |
t |
t |
n |
ASR-12 |
35.04072 |
112.28378 |
558 |
3.65 |
3.75 |
3.65 |
0.67 |
moderately sorted |
2.5 |
2.5 |
c |
63 |
17 |
18 |
0 |
1 |
t |
1 |
t |
t |
t |
n |
ASR-13 |
35.04072 |
112.28378 |
546 |
2.95 |
3.00 |
2.93 |
0.51 |
well sorted |
3.5 |
2.5 |
e |
68 |
17 |
15 |
0 |
0 |
t |
t |
t |
t |
t |
n |
ASR-14 |
35.04072 |
112.28378 |
587 |
3.04 |
3.00 |
2.98 |
0.58 |
moderately sorted |
3.0 |
2.5 |
e |
68 |
14 |
18 |
0 |
0 |
t |
t |
t |
0 |
t |
n |
ASR-15 |
35.04072 |
112.28378 |
501 |
3.08 |
3.00 |
2.97 |
0.67 |
moderately sorted |
3.0 |
3.0 |
e |
79 |
15 |
6 |
0 |
0 |
t |
t |
t |
t |
t |
n |
ASR Overall |
|
|
2400 |
3.18 |
3.00 |
3.10 |
0.71 |
poorly sorted |
3.1 |
2.9 |
|
71 |
16 |
12 |
|
|
|
|
|
|
|
|
Cave Spring Campground |
||||||||||||||||||||||
CSC-01 |
34.99660 |
111.73805 |
487 |
2.88 |
3.00 |
2.87 |
0.51 |
well sorted |
2.5 |
na |
c |
74 |
17 |
0 |
0 |
6 |
t |
t |
t |
t |
t |
n |
CSC-02 |
34.99660 |
111.73805 |
406 |
3.19 |
3.00 |
3.12 |
0.44 |
very well sorted |
3.5 |
na |
e |
75 |
16 |
0 |
0 |
6 |
0 |
t |
t |
t |
0 |
n |
CSC-Overall |
|
|
600 |
3.04 |
3.00 |
2.95 |
0.50 |
well sorted |
3.0 |
na |
|
75 |
17 |
0 |
|
|
|
|
|
|
|
|
Cottonwood Wash |
||||||||||||||||||||||
CW-01 |
34.36372 |
110.33038 |
448 |
3.23 |
3.25 |
3.21 |
0.48 |
well sorted |
3.5 |
2.5 |
e |
63 |
15 |
10 |
t |
2 |
0 |
t |
t |
0 |
t |
n |
CW-02 |
34.36372 |
110.33038 |
585 |
2.98 |
3.00 |
2.99 |
0.63 |
moderately sorted |
2.5 |
2.5 |
c |
74 |
17 |
6 |
t |
2 |
0 |
t |
t |
t |
t |
n |
CW-Overall |
|
|
600 |
3.10 |
3.25 |
3.12 |
0.56 |
moderately sorted |
3.0 |
2.5 |
|
69 |
16 |
8 |
|
|
|
|
|
|
|
|
Chino Point West |
||||||||||||||||||||||
CPW-05 |
35.35258 |
112.95542 |
488 |
3.22 |
3.00 |
3.14 |
0.56 |
moderately sorted |
3.0 |
3.5 |
e |
89 |
5 |
5 |
1 |
0 |
0 |
t |
t |
0 |
t |
n |
CPW-08 |
35.35258 |
112.95542 |
538 |
3.42 |
3.00 |
3.20 |
0.90 |
very poorly sorted |
3.5 |
3.5 |
e |
85 |
9 |
5 |
1 |
0 |
t |
t |
t |
0 |
t |
n |
CPW-10 |
35.35258 |
112.95542 |
435 |
3.13 |
3.25 |
3.05 |
0.54 |
well sorted |
3.5 |
3.0 |
e |
85 |
12 |
3 |
t |
0 |
t |
t |
0 |
t |
t |
n |
CPW-13 |
35.35258 |
112.95542 |
410 |
3.07 |
3.00 |
2.98 |
0.57 |
moderately sorted |
3.5 |
2.5 |
e |
90 |
10 |
t |
t |
0 |
t |
t |
t |
0 |
t |
n |
CPW-16 |
35.35258 |
112.95542 |
424 |
3.17 |
3.25 |
3.13 |
0.58 |
moderately sorted |
3.5 |
4.5 |
c |
91 |
4 |
2 |
4 |
t |
t |
t |
t |
t |
t |
n |
CPW-19 |
35.35258 |
112.95542 |
425 |
3.18 |
3.25 |
3.14 |
0.49 |
well sorted |
3.5 |
3.5 |
e |
92 |
8 |
t |
0 |
t |
t |
t |
t |
t |
t |
n |
CPW-23 |
35.35258 |
112.95542 |
420 |
3.32 |
3.50 |
3.27 |
0.83 |
poorly sorted |
3.5 |
1.5 |
e |
91 |
8 |
1 |
0 |
t |
t |
t |
t |
t |
t |
n |
CPW-25 |
35.35258 |
112.95542 |
465 |
2.92 |
3.00 |
2.87 |
0.65 |
moderately sorted |
4.0 |
3.0 |
e |
85 |
15 |
t |
t |
t |
t |
t |
t |
0 |
t |
n |
CPW-29 |
35.35258 |
112.95542 |
438 |
3.19 |
3.25 |
3.18 |
0.46 |
well sorted |
3.5 |
na |
e |
78 |
22 |
0 |
t |
t |
t |
t |
t |
0 |
t |
n |
CPW-32 |
35.35258 |
112.95542 |
422 |
3.17 |
3.25 |
3.12 |
0.49 |
well sorted |
3.0 |
2.5 |
e |
73 |
18 |
8 |
0 |
0 |
t |
t |
t |
t |
t |
n |
CPW-35 |
35.35258 |
112.95542 |
400 |
3.52 |
3.50 |
3.39 |
0.66 |
moderately sorted |
3.0 |
3.0 |
c |
73 |
18 |
8 |
1 |
0 |
t |
t |
t |
t |
t |
n |
CPW-37 |
35.35258 |
112.95542 |
412 |
3.14 |
3.25 |
3.12 |
0.50 |
well sorted |
3.5 |
3.0 |
e |
75 |
18 |
7 |
0 |
0 |
t |
t |
t |
0 |
t |
n |
CPW-39 |
35.35258 |
112.95542 |
458 |
3.22 |
3.25 |
3.18 |
0.52 |
well sorted |
3.5 |
3.0 |
e |
74 |
18 |
8 |
0 |
0 |
t |
t |
0 |
t |
t |
n |
CPW-41 |
35.35258 |
112.95542 |
421 |
3.17 |
3.25 |
3.11 |
0.50 |
well sorted |
3.5 |
3.0 |
e |
72 |
18 |
10 |
0 |
0 |
t |
0 |
t |
0 |
0 |
n |
CPW-Overall |
|
|
4200 |
3.20 |
3.25 |
3.12 |
0.61 |
moderately sorted |
3.4 |
82 |
13 |
5 |
|
|
|
|
|
|
|
|
|
|
Forestdale |
||||||||||||||||||||||
FD-05 |
34.15167 |
110.10280 |
510 |
2.91 |
2.75 |
2.78 |
0.66 |
moderately sorted |
3.5 |
3.0 |
e |
81 |
7 |
2 |
0 |
t |
t |
t |
0 |
0 |
t |
n |
FD-06 |
34.15167 |
110.10280 |
557 |
2.84 |
2.75 |
2.76 |
0.52 |
well sorted |
4.0 |
3.5 |
e |
84 |
4 |
4 |
0 |
8 |
0 |
t |
0 |
0 |
0 |
n |
FD-07 |
34.15814 |
110.10100 |
761 |
2.76 |
2.50 |
2.73 |
0.70 |
poorly sorted |
3.5 |
na |
e |
88 |
6 |
0 |
0 |
6 |
t |
t |
t |
t |
t |
n |
FD-08 |
34.15814 |
110.10100 |
487 |
2.59 |
2.75 |
2.53 |
0.77 |
poorly sorted |
3.5 |
na |
e |
88 |
10 |
0 |
0 |
2 |
0 |
t |
t |
t |
t |
n |
FD-09 |
34.16282 |
110.09975 |
411 |
2.86 |
3.00 |
2.96 |
0.68 |
moderately sorted |
3.0 |
na |
c |
83 |
7 |
0 |
1 |
8 |
0 |
0 |
t |
t |
t |
n |
FD-10 |
34.16282 |
110.09975 |
469 |
2.67 |
2.75 |
2.68 |
0.61 |
moderately sorted |
3.0 |
na |
e |
90 |
t |
0 |
0 |
10 |
0 |
0 |
0 |
t |
0 |
n |
FD-11 |
34.17132 |
110.09808 |
695 |
2.77 |
3.00 |
2.79 |
0.70 |
poorly sorted |
3.0 |
na |
e |
88 |
5 |
0 |
0 |
7 |
0 |
0 |
0 |
0 |
0 |
n |
FD-12 |
34.17132 |
110.09808 |
776 |
2.86 |
3.25 |
2.93 |
0.71 |
poorly sorted |
2.5 |
na |
e |
85 |
7 |
0 |
0 |
8 |
0 |
0 |
0 |
t |
0 |
n |
FD-13 |
34.17500 |
110.09743 |
565 |
2.43 |
3.00 |
2.61 |
0.96 |
very poorly sorted |
3.5 |
na |
e |
88 |
4 |
0 |
0 |
8 |
0 |
t |
0 |
t |
t |
n |
FD-14 |
34.18333 |
110.09342 |
550 |
2.91 |
3.00 |
2.87 |
0.50 |
well sorted |
3.5 |
na |
e |
85 |
5 |
0 |
0 |
10 |
0 |
t |
t |
t |
t |
n |
FD-Overall |
|
|
3000 |
2.76 |
3.00 |
2.78 |
0.71 |
poorly sorted |
3.3 |
86 |
6 |
1 |
|
|
|
|
|
|
|
|
|
|
Hermit Trail |
||||||||||||||||||||||
HMT-01 |
36.05527 |
112.22035 |
515 |
2.99 |
3.00 |
2.94 |
0.65 |
moderately sorted |
3.0 |
3.5 |
e |
73 |
25 |
2 |
0 |
t |
0 |
0 |
t |
t |
t |
n |
HMT-02 |
36.05518 |
112.22033 |
392 |
3.16 |
3.25 |
3.12 |
0.52 |
well sorted |
2.5 |
3.0 |
c |
67 |
25 |
3 |
0 |
5 |
t |
0 |
t |
t |
0 |
n |
HMT-03 |
36.05523 |
112.22027 |
679 |
3.00 |
3.00 |
2.94 |
0.53 |
well sorted |
3.0 |
3.5 |
e |
72 |
22 |
3 |
0 |
3 |
t |
0 |
t |
0 |
t |
n |
HMT-04 |
36.05522 |
112.22007 |
450 |
3.29 |
3.25 |
3.23 |
0.66 |
moderately sorted |
2.0 |
3.5 |
e |
74 |
18 |
4 |
0 |
4 |
t |
0 |
t |
t |
t |
n |
HMT-05 |
36.05510 |
112.22012 |
581 |
3.78 |
4.00 |
3.81 |
0.75 |
poorly sorted |
2.5 |
3.0 |
e |
73 |
18 |
4 |
0 |
5 |
<1 |
0 |
t |
t |
t |
y |
HMT-06 |
36.05505 |
112.21993 |
503 |
2.78 |
2.75 |
2.73 |
0.49 |
well sorted |
2.5 |
3.0 |
e |
82 |
12 |
3 |
0 |
3 |
0 |
0 |
t |
0 |
0 |
t |
HMT-07 |
36.05550 |
112.21910 |
559 |
2.92 |
3.00 |
2.87 |
0.54 |
well sorted |
2.5 |
3.5 |
e |
77 |
15 |
3 |
0 |
5 |
t |
0 |
t |
t |
t |
n |
HMT-08 |
36.05595 |
112.21848 |
456 |
3.26 |
3.00 |
3.22 |
0.62 |
moderately sorted |
3.0 |
3.5 |
e |
72 |
15 |
6 |
0 |
7 |
t |
0 |
t |
t |
t |
? |
HMT-09 |
36.05633 |
112.21833 |
418 |
3.10 |
3.00 |
3.04 |
0.52 |
well sorted |
2.5 |
3.5 |
e |
66 |
25 |
4 |
0 |
5 |
t |
? |
t |
t |
t |
? |
HMT-10 |
36.05620 |
112.21803 |
386 |
3.12 |
3.00 |
3.06 |
0.72 |
poorly sorted |
3.0 |
3.5 |
e |
77 |
15 |
5 |
0 |
3 |
t |
0 |
t |
t |
t |
n |
HMT-Overall |
|
|
3000 |
3.13 |
3.00 |
3.04 |
0.66 |
moderately sorted |
2.7 |
3.4 |
|
73 |
19 |
4 |
0 |
4 |
|
|
|
|
|
|
Holbrook |
||||||||||||||||||||||
HOL-01 |
34.83447 |
110.14444 |
549 |
2.97 |
3.00 |
2.91 |
0.62 |
moderately sorted |
3.5 |
2.5 |
e |
86 |
9 |
5 |
0 |
t |
t |
t |
t |
t |
t |
n |
HOL-02 |
34.76949 |
110.12708 |
604 |
2.87 |
2.75 |
2.81 |
0.58 |
moderately sorted |
2.5 |
2.5 |
c |
86 |
9 |
5 |
0 |
t |
t |
t |
0 |
t |
t |
n |
HOL-03 |
34.63827 |
110.09557 |
596 |
2.61 |
2.50 |
2.52 |
0.79 |
poorly sorted |
3.0 |
2.5 |
e |
87 |
10 |
3 |
0 |
t |
0 |
t |
t |
0 |
t |
n |
HOL-04 |
34.59130 |
110.08624 |
530 |
2.55 |
2.75 |
2.51 |
0.69 |
moderately sorted |
3.0 |
na |
e |
89 |
10 |
0 |
t |
1 |
t |
0 |
0 |
0 |
0 |
n |
HOL-05 |
34.45013 |
110.07483 |
558 |
2.76 |
3.25 |
2.92 |
0.76 |
poorly sorted |
3.5 |
na |
e |
88 |
10 |
0 |
t |
2 |
0 |
0 |
0 |
0 |
0 |
n |
HOL-Overall |
|
|
1500 |
2.76 |
2.75 |
2.77 |
0.72 |
poorly sorted |
3.1 |
2.5 |
|
87 |
10 |
3 |
|
|
|
|
|
|
|
|
Jumpup Spring |
||||||||||||||||||||||
JUS-05 |
36.58533 |
112.54714 |
743 |
3.99 |
4.00, |
4.00 |
0.94 |
very poorly sorted |
2.0 |
2.0 |
e |
85 |
8 |
7 |
0 |
t |
t |
t |
0 |
0 |
t |
y |
JUS-06 |
36.58533 |
112.54714 |
398 |
3.36 |
3.50 |
3.31 |
0.77 |
poorly sorted |
3.0 |
2.5 |
e |
85 |
5 |
10 |
0 |
t |
t |
t |
t |
t |
t |
n |
JUS-07 |
36.58533 |
112.54714 |
482 |
3.20 |
3.25 |
3.18 |
0.83 |
poorly sorted |
2.5 |
3.0 |
c |
85 |
8 |
6 |
0 |
t |
t |
0 |
0 |
0 |
0 |
y |
JUS-08 |
36.58533 |
112.54714 |
564 |
3.22 |
3.25 |
3.20 |
0.81 |
poorly sorted |
2.5 |
3.0 |
e |
80 |
10 |
10 |
0 |
t |
t |
t |
0 |
t |
t |
n |
JUS-09 |
36.58533 |
112.54714 |
391 |
3.37 |
3.00 |
3.28 |
1.13 |
very poorly sorted |
2.5 |
2.0 |
e |
93 |
1 |
6 |
0 |
0 |
t |
0 |
0 |
0 |
0 |
y |
JUS-Overall |
|
|
1500 |
3.42 |
3.25 |
3.37 |
0.97 |
very poorly sorted |
2.5 |
2.5 |
|
86 |
6 |
8 |
|
|
|
|
|
|
|
|
New Hance Trail |
||||||||||||||||||||||
NH-11 |
35.99735 |
111.93817 |
444 |
3.19 |
3.00 |
3.12 |
0.61 |
moderately sorted |
3.0 |
2.5 |
e |
76 |
20 |
3 |
0 |
1 |
t |
0 |
0 |
t |
t |
? |
NH-12 |
35.99735 |
111.93810 |
485 |
3.37 |
3.75 |
3.37 |
0.71 |
poorly sorted |
2.5 |
3.0 |
e |
65 |
28 |
2 |
0 |
5 |
t |
0 |
t |
t |
t |
? |
NH-13 |
35.99733 |
111.93810 |
372 |
3.03 |
2.75 |
2.91 |
0.57 |
moderately sorted |
3.0 |
3.5 |
e |
70 |
28 |
2 |
0 |
t |
t |
0 |
0 |
t |
t |
n |
NH-14 |
35.99587 |
111.93867 |
469 |
3.35 |
3.00 |
3.29 |
0.70 |
poorly sorted |
2.5 |
3.5 |
e |
61 |
28 |
1 |
0 |
10 |
t |
0 |
t |
t |
t |
n |
NH-15 |
35.99562 |
111.93835 |
445 |
3.33 |
3.75 |
3.27 |
0.71 |
poorly sorted |
3.0 |
3.5 |
e |
65 |
25 |
2 |
0 |
8 |
t |
0 |
t |
t |
t |
n |
NH-16 |
35.99568 |
111.93835 |
369 |
3.19 |
3.00 |
3.06 |
0.74 |
poorly sorted |
2.5 |
3.5 |
e |
66 |
28 |
1 |
0 |
5 |
t |
0 |
t |
t |
t |
n |
NH-17 |
35.99542 |
111.93832 |
518 |
3.49 |
4.00 |
3.50 |
0.74 |
poorly sorted |
3.0 |
4.0 |
e |
66 |
28 |
1 |
0 |
5 |
t |
0 |
t |
t |
t |
? |
NH-18 |
35.99598 |
111.93777 |
423 |
3.22 |
3.00 |
3.15 |
0.63 |
moderately sorted |
2.5 |
3.0 |
c |
65 |
28 |
1 |
0 |
5 |
t |
0 |
t |
t |
t |
? |
NH-19 |
35.99595 |
111.93745 |
389 |
3.06 |
3.00 |
2.97 |
0.63 |
moderately sorted |
3.0 |
3.5 |
e |
65 |
28 |
2 |
0 |
4 |
0 |
1 |
t |
t |
t |
? |
NH-20 |
35.99605 |
111.93737 |
446 |
3.18 |
3.25 |
3.12 |
0.59 |
moderately sorted |
2.5 |
3.5 |
e |
64 |
28 |
2 |
0 |
5 |
<1 |
1 |
t |
t |
t |
? |
NHT-07 |
35.99795 |
111.94110 |
685 |
4.01 |
3.50 |
4.00 |
0.86 |
poorly sorted |
2.5 |
na |
e |
95 |
5 |
0 |
t |
t |
t |
t |
t |
t |
t |
y |
NHT-08 |
35.99795 |
111.94110 |
612 |
3.92 |
4.00 |
3.88 |
0.79 |
poorly sorted |
2.0 |
na |
c |
88 |
13 |
0 |
t |
t |
t |
t |
t |
t |
t |
y |
NHT-Overall |
|
|
3600 |
3.37 |
3.00 |
3.28 |
0.76 |
poorly sorted |
2.7 |
3.4 |
|
70 |
24 |
1 |
|
|
|
|
|
|
|
|
Pine Creek Trail |
||||||||||||||||||||||
PCT-02 |
34.44139 |
111.42278 |
620 |
2.97 |
3.00 |
2.93 |
0.59 |
moderately sorted |
4.5 |
3.5 |
e |
84 |
11 |
3 |
t |
2 |
t |
t |
0 |
t |
t |
n |
PCT-03 |
34.44139 |
111.42278 |
476 |
3.39 |
3.50 |
3.62 |
0.63 |
moderately sorted |
2.5 |
2.5 |
e |
81 |
11 |
6 |
0 |
2 |
t |
t |
t |
t |
t |
n |
PCT-04 |
34.44139 |
111.42278 |
552 |
3.12 |
3.25 |
3.10 |
0.69 |
moderately sorted |
4.5 |
2.5 |
c |
83 |
11 |
6 |
0 |
t |
t |
t |
t |
t |
t |
n |
PCT-05 |
34.44139 |
111.42278 |
448 |
2.91 |
2.75 |
2.87 |
0.73 |
poorly sorted |
4.0 |
3.5 |
e |
85 |
10 |
3 |
t |
2 |
t |
t |
0 |
t |
t |
n |
PCT-06 |
34.44139 |
111.42278 |
464 |
3.50 |
3.75 |
3.48 |
0.64 |
moderately sorted |
2.5 |
3.0 |
e |
83 |
7 |
8 |
0 |
2 |
t |
t |
t |
t |
t |
n |
PCT-08 |
34.44139 |
111.42278 |
452 |
3.29 |
3.25 |
3.25 |
0.57 |
moderately sorted |
3.0 |
3.5 |
e |
83 |
7 |
8 |
0 |
2 |
t |
t |
t |
t |
t |
n |
PCT-09 |
34.44139 |
111.42278 |
655 |
3.03 |
3.25 |
3.02 |
0.56 |
moderately sorted |
3.0 |
3.5 |
e |
86 |
11 |
3 |
0 |
t |
0 |
t |
t |
t |
t |
n |
PCT-11 |
34.44139 |
111.42278 |
391 |
3.03 |
3.25 |
3.03 |
0.49 |
well sorted |
2.5 |
3.5 |
e |
84 |
11 |
3 |
0 |
2 |
0 |
t |
t |
t |
t |
n |
PCT-12 |
34.44139 |
111.42278 |
327 |
2.88 |
2.75 |
2.87 |
0.50 |
well sorted |
3.0 |
3.5 |
e |
85 |
12 |
3 |
0 |
t |
t |
t |
t |
t |
t |
n |
PCT-13 |
34.44139 |
111.42278 |
661 |
2.90 |
3.00 |
2.87 |
0.44 |
very well sorted |
3.5 |
na |
e |
85 |
12 |
t |
0 |
3 |
0 |
t |
t |
t |
t |
n |
PCT-14 |
34.44139 |
111.42278 |
498 |
2.80 |
3.00 |
2.80 |
0.77 |
poorly sorted |
2.5 |
na |
e |
82 |
15 |
0 |
0 |
3 |
t |
t |
t |
t |
t |
n |
PCT-15 |
34.44139 |
111.42278 |
500 |
2.60 |
2.75 |
2.57 |
0.79 |
poorly sorted |
3.5 |
na |
e |
79 |
18 |
0 |
0 |
3 |
t |
t |
0 |
t |
t |
n |
PCT-16 |
34.44139 |
111.42278 |
464 |
2.51 |
2.75 |
2.51 |
0.64 |
moderately sorted |
3.5 |
na |
e |
87 |
10 |
0 |
0 |
3 |
0 |
t |
0 |
0 |
t |
n |
PCT-17 |
34.44139 |
111.42278 |
474 |
2.82 |
3.00 |
2.81 |
0.60 |
moderately sorted |
3.0 |
na |
c |
79 |
18 |
t |
0 |
3 |
t |
t |
0 |
0 |
t |
n |
PCT-18 |
34.44139 |
111.42278 |
469 |
2.77 |
2.75 |
2.80 |
0.85 |
poorly sorted |
3.5 |
na |
e |
81 |
16 |
0 |
0 |
3 |
t |
t |
t |
t |
t |
n |
PCT-19 |
34.44139 |
111.42278 |
411 |
2.84 |
2.75 |
2.80 |
0.70 |
poorly sorted |
3.0 |
na |
e |
81 |
15 |
0 |
t |
4 |
0 |
t |
t |
t |
t |
n |
PCT-Overall |
|
|
4800 |
2.96 |
3.00 |
2.95 |
0.69 |
moderately sorted |
3.3 |
3.2 |
|
83 |
12 |
3 |
|
|
|
|
|
|
|
|
South Kaibab Trail |
||||||||||||||||||||||
SK-03 |
36.06147 |
112.08582 |
546 |
3.46 |
2.75 |
3.08 |
1.08 |
very poorly sorted |
2.5 |
na |
e |
92 |
8 |
0 |
t |
t |
t |
t |
t |
t |
t |
y |
SK-04 |
36.06147 |
112.08582 |
409 |
3.31 |
3.25 |
3.18 |
0.71 |
poorly sorted |
3.0 |
na |
c |
79 |
19 |
0 |
2 |
t |
t |
0 |
t |
t |
t |
y |
SK-Overall |
|
|
600 |
3.41 |
3.00 |
3.19 |
0.91 |
very poorly sorted |
2.8 |
|
|
85 |
14 |
0 |
|
|
|
|
|
|
|
|
Trail Canyon |
||||||||||||||||||||||
TC-05 |
36.28803 |
11.33016 |
468 |
3.45 |
3.75 |
3.47 |
0.65 |
moderately sorted |
3.0 |
3.0 |
e |
79 |
11 |
10 |
t |
t |
t |
t |
0 |
0 |
t |
n |
TC-06 |
36.28803 |
11.33016 |
431 |
3.35 |
3.25 |
3.28 |
0.65 |
moderately sorted |
2.5 |
3.0 |
c |
78 |
11 |
8 |
2 |
1 |
t |
t |
0 |
t |
t |
n |
TC-07 (core) |
36.28803 |
11.33016 |
634 |
3.38 |
3.50 |
3.47 |
0.86 |
poorly sorted |
2.5 |
2.5 |
e |
94 |
0 |
6 |
0 |
t |
t |
t |
0 |
0 |
t |
y |
TC-07 (oolith) |
36.28803 |
11.33016 |
568 |
2.66 |
2.75 |
2.73 |
0.73 |
poorly sorted |
||||||||||||||
TC-08 (core) |
36.28803 |
11.33016 |
542 |
3.73 |
3.75 |
3.62 |
0.64 |
moderately sorted |
1.5 |
1.5 |
e |
88 |
0 |
12 |
t |
t |
0 |
t |
0 |
t |
t |
y |
TC-Overall (core) |
|
|
1200 |
3.47 |
3.50 |
3.47 |
0.71 |
poorly sorted |
2.4 |
2.5 |
|
85 |
6 |
9 |
|
|
|
|
|
|
|
|
Warm Springs Canyon |
||||||||||||||||||||||
WSC-29 |
36.67507 |
112.34345 |
427 |
3.21 |
3.25 |
3.23 |
0.56 |
moderately sorted |
3.0 |
3.0 |
e |
82 |
5 |
10 |
t |
3 |
t |
t |
t |
t |
t |
y |
WSC-10 |
36.67507 |
112.34345 |
521 |
3.27 |
3.00 |
3.24 |
0.88 |
poorly sorted |
3.0 |
3.0 |
e |
80 |
10 |
8 |
0 |
2 |
t |
t |
0 |
0 |
t |
y |
WSC-12 |
36.67507 |
112.34345 |
586 |
3.60 |
3.50 |
3.56 |
0.60 |
moderately sorted |
2.5 |
3.0 |
c |
74 |
14 |
9 |
0 |
4 |
t |
t |
t |
t |
t |
y |
WSC-13 |
36.67507 |
112.34345 |
408 |
3.54 |
3.00 |
3.27 |
0.88 |
poorly sorted |
2.5 |
3.5 |
e |
74 |
14 |
8 |
0 |
4 |
t |
t |
t |
t |
t |
y |
WSC-14 |
36.67507 |
112.34345 |
492 |
3.31 |
3.25 |
3.23 |
0.58 |
moderately sorted |
3.0 |
3.0 |
e |
79 |
8 |
9 |
0 |
4 |
t |
t |
t |
t |
t |
n |
WSC-Overall |
|
|
1500 |
3.37 |
3.25 |
3.31 |
0.88 |
poorly sorted |
2.8 |
3.1 |
|
78 |
10 |
9 |
|
|
|
|
|
|
|
|
Whitmore Canyon |
||||||||||||||||||||||
WC-03 |
36.26957 |
113.22733 |
658 |
3.73 |
3.50 |
3.68 |
0.64 |
moderately sorted |
3.0 |
2.5 |
e |
79 |
8 |
8 |
0 |
5 |
t |
t |
t |
t |
t |
y |
WC-04 |
36.26957 |
113.22733 |
482 |
2.46 |
2.25 |
2.25 |
1.14 |
very poorly sorted |
3.5 |
3.0 |
e |
95 |
4 |
t |
0 |
1 |
0 |
t |
0 |
0 |
t |
n |
WC-05 |
36.26957 |
113.22733 |
467 |
3.26 |
3.25 |
3.21 |
0.54 |
well sorted |
2.0 |
3.0 |
c |
74 |
17 |
6 |
0 |
2 |
0 |
t |
t |
t |
t |
n |
WC-06 |
36.26957 |
113.22733 |
501 |
3.67 |
3.50 |
3.56 |
0.86 |
poorly sorted |
2.0 |
3.0 |
e |
85 |
6 |
6 |
0 |
3 |
t |
t |
t |
0 |
t |
y |
WC-07 |
36.26957 |
113.22733 |
393 |
2.77 |
2.75 |
2.75 |
0.65 |
moderately sorted |
3.0 |
3.5 |
e |
88 |
8 |
2 |
t |
2 |
0 |
t |
t |
t |
t |
n |
WC-08 |
36.26957 |
113.22733 |
|
|
|
|
|
|
|
|
|
|
|
|
|
|
|
|
|
|
|
y |
WC-Overall |
|
|
1500 |
3.18 |
3.50 |
3.19 |
0.94 |
very poorly sorted |
2.7 |
3.0 |
|
84 |
9 |
6 |
|
|
|
|
|
|
|
|
Results
The overall data and statistical results for the Coconino thin sections that we systematically analyzed are reported in Table 1. The details of the mineral composition, grain size, sorting, and rounding within the Coconino Sandstone follow below. All results using grain size measurements are uncorrected long axes measurements.
Mineral composition and characterization
Quartz constitutes the majority of the mineralogical component of the Coconino (Fig. 5). Here it is distinguished lithologically from the chert (see the following section) but crystallographically (XRD) it is indistinguishable from chert. Grain size is as described in other sections of this report; however there are some variables in the quartz that should be noted. Rounding, which is presumed to be controlled by transport of individual particles within the depositional environment, is variable. Finer-grained particles are significantly less rounded than are the larger particles. Where bimodality is present (grain diameters vary by an order of magnitude), the large grains generally are rounded to well-rounded. These large grains are often suspended in a finer-grained matrix of angular and sometimes highly angular grains. Quartz grains may show some variation in extinction under cross-polarized light. Most grains display uniform extinction (as opposed to undulose extinction). Occasionally, quartz grains are sutured creating indentation or micro-stylolites.
Quartz grains display some variability of clarity, and this is caused primarily by inclusions. These can be either fluid inclusions or solid inclusions. Solid inclusions are also observed and include materials (most likely clays) trapped between the detrital grains and cements as “dust rims.” In addition, a number of the larger grains that are in the coarse grain size to near-granule size contain linear, needle-like voids that most likely have been enhanced by hydrofluoric acid (HF) etching associated with K-feldspar staining. These look vaguely like fission tracks, although no inclusions are seen to be associated with them.
Quartz, in addition to comprising the detrital grains, also occurs as the major cement in the Coconino. The degree of cementation can be highly variable with almost no lithification (some samples hardly survived transport to the laboratory due to the poor degree of cementation) to almost complete cementation, leaving virtually no primary porosity intact. It is presumed that the source of the silica for the quartz cementation comes from either grain surface dissolution, sutures caused by compaction or possibly partly from feldspar dissolution.
Chert is found in minor amounts in most locations in the Coconino (Fig. 5). Grain sizes vary per location and may be as large as medium sand-size in some northern locations, but average around fine to very fine sand-sized. Chert is mainly found as detrital sub-rounded to rounded grains. Detrital chert grains were categorized as one of two types based on overall purity of silica. The first type is a clean chert, which has a high purity of quartz, and the second is a dirty chert which has argillaceous material interspersed or interbedded with the quartz. Overall both types of chert exhibit similar textures, either a uniform cryptocrystalline texture or a combination of microquartz and megaquartz texture. Chert is also found undergoing preferential internal dissolution when compared with other silica-based minerals. On average, chert is found to be finer grained when compared with other quartz grains.
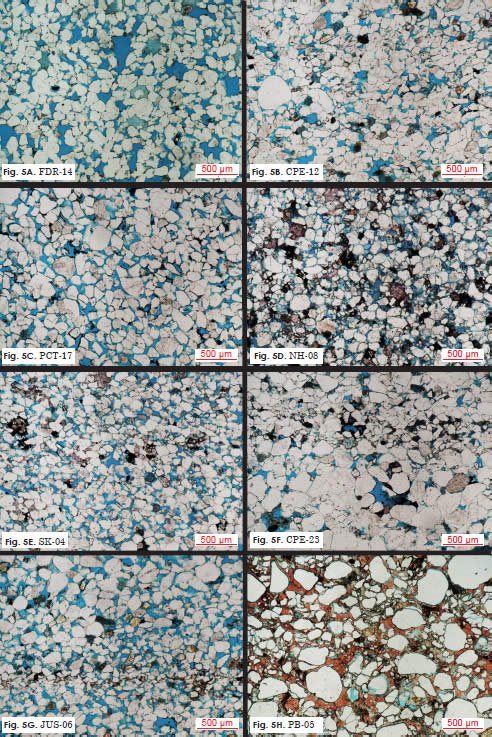
Fig. 5. A variety of thin sections of Coconino Sandstone showing the “typical” occurrence of quartz. In all of the thin sections, blue is epoxy (or pore space). The white colored grains are quartz. Chert is typically a dirty white color (there is a large chert grain in the lower right of 5F). Red stain is calcite cement (as in 5D and 5H). Potassium feldspar is stained yellow (as in 5G). Kaolinite is a baby blue stippled color (as in 5A).
As a general trend K-feldspar tended to be more abundant in the northern part of the formation and diminished southward, both in size and abundance (consult Table 1). No particular vertical distribution patterns were noted with K-feldspar. Some locations such as ASR contained abundant K-feldspar, as much as 18%. Other locations contained none, or only trace amounts. It was quite typical for the K-feldspar grains to be as angular as or more angular than the surrounding quartz grains (compare the two rounding columns in Table 1, Fig. 6). This might be explained, in part, because the K-feldspar was usually slightly smaller than the quartz (smaller grains usually tend to be more angular). However, K-feldspar grains just as large as the quartz grains could usually be found that exhibited similar angularity to the smaller grains. In many thin sections K-feldspar often exhibited dissolution textures, either partial or complete. Oddly, in some thin sections, dissolution seemed to be rather random, with nearly complete dissolution of some grains and no dissolution at all of other nearby grains. The angular K-feldspar grains cannot be due to cleavage in the mineral. We have observed rounded K-feldspar in coastal dunes, next to angular K-feldspar in beach sands (McMaster, Whitmore, and Strom 2010).
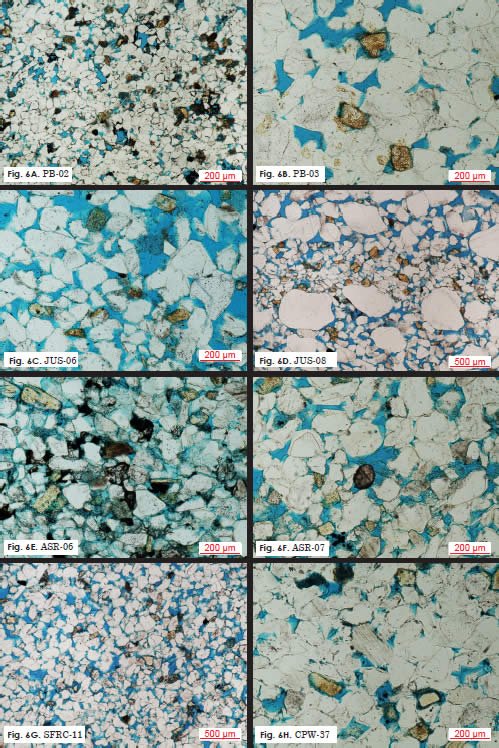
Fig. 6. A variety of thin sections showing the occurrence of potassium feldspar (K-feldspar) in the Coconino Sandstone. K-feldspar is stained yellow during thin section production. Note that the K-feldspar is often just as angular as and sometimes even more angular than the harder quartz grains surrounding it.
Nearly all thin sections contained trace amounts of mica (Fig. 7, Table 1) which was usually in the form of muscovite. Some flakes were as big as or larger than the quartz grains that surrounded them. Most commonly they were smaller than the mean size of the quartz. Mica was found throughout the vertical and lateral extent of the formation (Table 1). Zircon, brown tourmaline and black opaque minerals (probably magnetite) were also common trace minerals in nearly every thin section. These minerals were often well-rounded and about 30–50% smaller than the surrounding quartz grains.
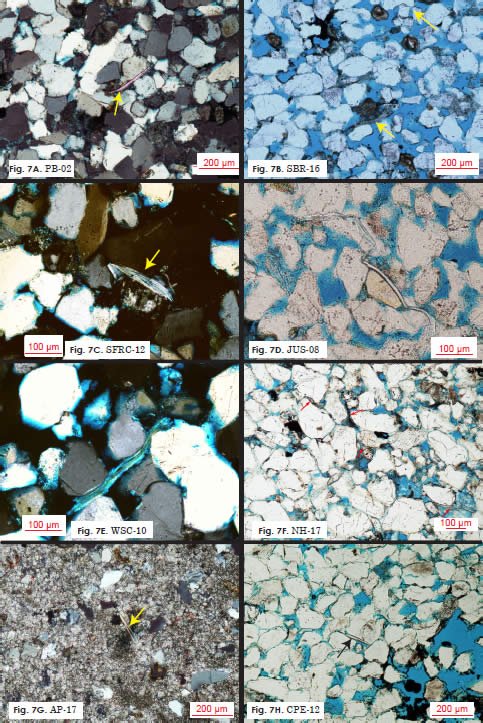
Fig. 7. A variety of thin sections showing the occurrence of mica (mostly muscovite) in the Coconino Sandstone. Because mica occurs in “books” it often appears as a long thin strand under the microscope. Sometimes the sheets of mica can be seen splaying apart (as in 7C and 7G). Mica was found in almost every thin section throughout the vertical and lateral extent of the Coconino. It is often the same size as the quartz sand grains, or even larger. Mica shows low to moderate compaction as evidenced by the range of straight to mildly bent sheets.
We found various forms of dolomite in approximately half of the outcrop area of the Coconino including the Grand Canyon (see Fig. 8). Dolomite most commonly occurred near the bottoms and the tops of the sections. The dolomite in the Coconino is found in four different textural forms: ooids, clasts, cements, and beds.
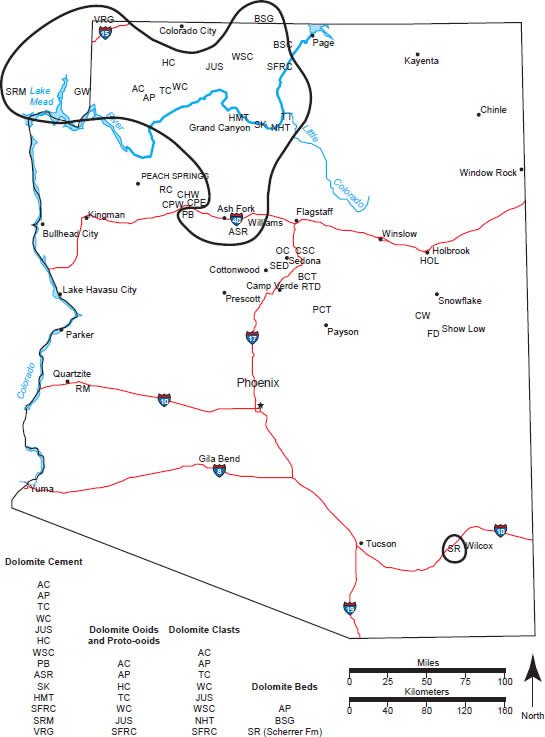
Fig. 8. Map of the occurrence of various types of dolomite found within the Coconino. Dolomite occurred as ooids, proto-ooids, cement and rhombs, clasts and beds. Most dolomite occurrences were found north of I-40. The Scherrer Formation (in southern Arizona) is a marine equivalent of the Coconino and also has bedded dolomite.
Dolomitic beds (Fig. 9 and Fig. 10) mainly display a non-planar to planar-s type fabric. The dolomite crystals vary from anhedral to euhedral depending on the overall mineralogy of the beds. Overall mineralogy varies from 98% to 60% based on XRD analysis and petrographic estimations. The crystal shape of the dolomite becomes more euhedral as dolomite content decreases. The dolomite beds are found to have little to no porosity. The dolomite beds at AP and BSG both contain small fossil fragments which are difficult to identify. Four dolomite beds occurred near the bottom of the section at AP (Fig. 9); each bed being 3–5 cm (1.1–1.9 in) thick and containing fine sand stringers between them (about 0.75 m (2.4 ft) above the Hermit Formation). Cross-bedded Coconino (with dolomite ooids) occurred about 15 cm (5.9 in) above this sequence. At BSG the carbonate beds occurred about 3.5 m (11.4 ft) above the Hermit and were of a similar nature. Most of the Coconino at BSG was planar-bedded with the exception of a few cross-bed sets near the top of the 20 m (65.6 ft) section. Dolomite beds were also found on Scherrer Ridge (SR) in the Scherrer Formation, a probable Coconino equivalent (Ross and Tyrrell 1965). The Tensleep Sandstone (Mankiewicz and Steidtmann 1979) and the Weber Sandstone (Driese 1985) also have dolomite beds reported within them.
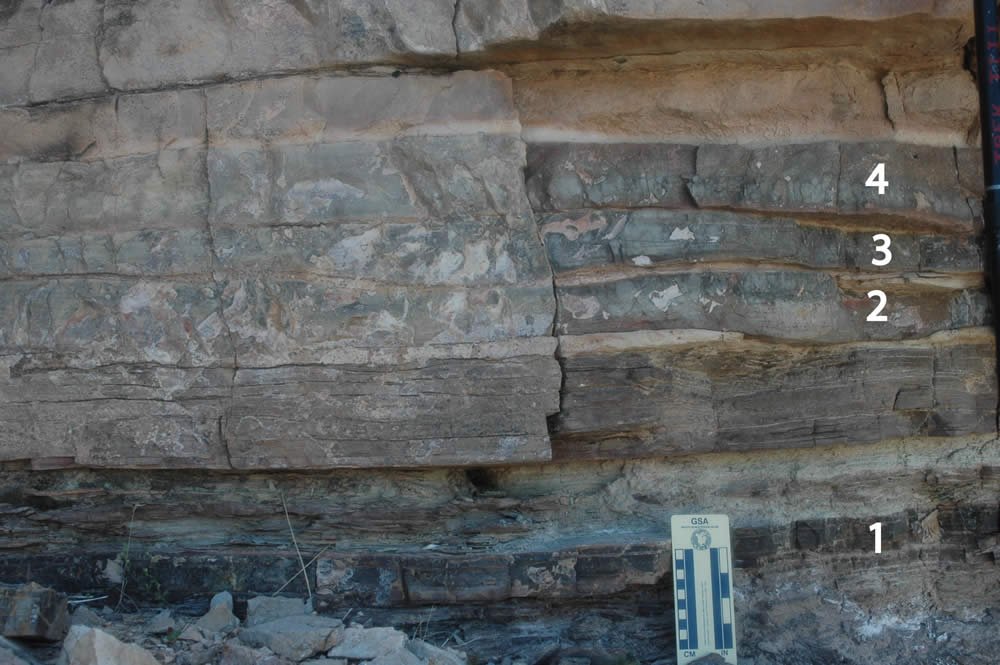
Fig. 9. Four dolomite beds with interbedded sandstone layers at Andrus Point (AP), Arizona.
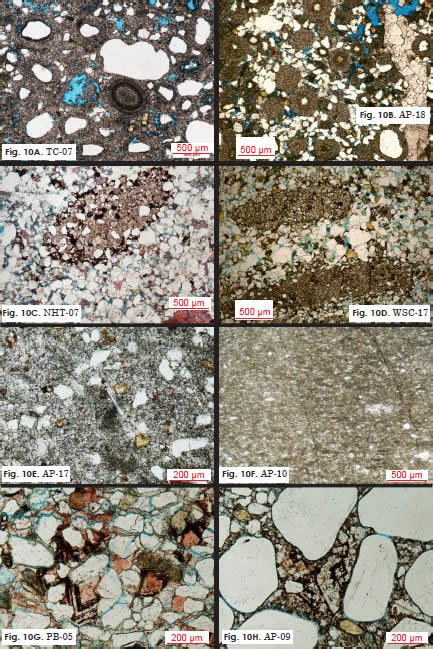
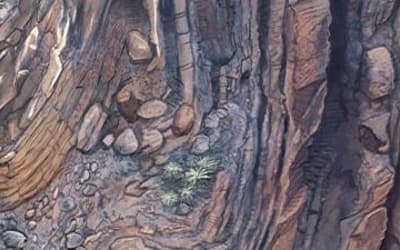
Fig. 10. A variety of thin sections showing the occurrence of dolomite in the Coconino Sandstone. The brownish mineral is dolomite; the red-stained mineral is calcite. Fig. 10A and B: Dolomite ooids occurred at several localities in the northern part of the outcrop. They occurred in the typical cross-bedded portion of the Coconino. The ooids had cores of either quartz or K-feldspar. Fig. 10C and D: Dolomite clasts were found at many localities. The clasts were often many times larger than the quartz grains surrounding them and would seem to require non-eolian processes to transport them and preserve them without the harder quartz completely destroying the softer dolomite. Some clasts occur as pure dolomite; others, like these, have quartz grains making up part of the clasts. Dolomite clasts can occur well into the Coconino sand sea (> 100 km [62.1 mi] from the northern edge). Fig.10E was collected at the base of a thick crossbedded section in the Coconino that occurs just above the photo in Fig. 9. Fig. 10F is the bottom of the dolomite bed of Fig. 9 and has exceptionally high purity, with only a few quartz sand grains. Fig. 10G and H: Dolomite cement occurred at many localities in the northern part of the outcrop area; sometimes calcite replaced dolomite rhombs (as in 10G).
Dolomitic ooids (Fig. 10) are typically spherical and are up to 500 μm (0.5 mm) in diameter with the largest up to 900 μm (0.9 mm) in diameter. The nuclei, when present, are composed of quartz or feldspar grains. It is important to note that ooids may not have been sectioned through the center and this will result in some nucleated ooids appearing un-nucleated. The nucleated grains have a bimodal size distribution where the largest grains are medium sand-sized and the smallest are fine to very fine sand-sized. The size of the nucleus has little bearing on overall ooid size, where, overall, ooids are well-sorted. Occasionally the nuclei of the ooids are found leached with partial residue or no grain present. The ooids are composed of a sucrosic microcrystalline dolomite forming concentric laminae. The concentric laminae are distinguished by alternating darker and lighter layers. The number of concentric bands varies per ooid and is not consistent overall. The dolomite forming the laminae displays a nonplanar to planar-s fabric (Sibley and Gregg 1987) with interstitial porosity occasionally present. Dolomitic ooids that have undergone some internal dissolution have revealed skeletal structure that may represent radial growth patterns. Proto-ooids are also present and are identified by a single isopachous growth layer around a quartz or feldspar nucleus. Proto-ooids are usually found in close proximity to the ooids in outcrop; however, there are cases where ooids are not found in the vicinity of the proto-ooids. Ooids only rarely show signs of compaction, except the ooids at HC, with little in the way of erosional or abrasive features on ooid surfaces. Signs of compaction include de-lamination of some of the layers in some ooids and distortion or deformation of ooids sub-parallel to bedding planes. These signs of compaction occur more frequently in ooids with fully leached nuclei. In most cases, however, the majority of ooids are fully intact and there are few abraded or broken ooids or other signs of mechanical alteration. Observed digenetic features include de-dolomitization into calcite, partial internal dissolution and compaction. Dolomite ooids are exclusively found in cross-bedded sets in the upper part of the Coconino. Fig. 8 shows all of the locations in which we have found ooids and proto-ooids.
Dolomitic cements (Fig. 10) occur mainly as subhedral to euhedral rhombs replacing porosity or as recrystallized cement. Dolomite rhombs are microcrystalline to medium crystalline. Coarser crystalline dolomite is found in three textural forms. The first textural form has strong cleavage markings on the grain, with some rhombs having single or multiple dark insoluble precipitate layer(s). These mark previous crystal surfaces, indicating growth cycles of the dolomite rhomb (these crystal zonations are also observed under cathodoluminescence). The second textural form has no cleavage markings on the grain surface and no association with the dark insoluble precipitate layer, unlike the first dolomite type. The third textural form is found as a replacement mineral associated with fossil fragments (e.g. infill of shell fragments). Partial de-dolomitization of dolomite into calcite varies and is dependent on the textural type of dolomite. Observed diagenetic features include partial de-dolomitization into calcite and partial to almost complete dissolution. Dolomite cements are widespread in the dolomite-bearing portion of the Coconino Sandstone.
Dolomitic clasts (Fig. 10) are composed of aggregates of microcrystalline dolomite. These dolomite crystals mainly form non-planar crystal fabrics with anhedral crystal surfaces. The clasts vary between 100% to 80% dolomite with the remaining mineralogy consisting predominantly of quartz and feldspar. Dolomitic clasts can be found upwards of granule size (~2 mm [0.078 in]) and as small as medium to fine sand-sized, while the matrix is medium to very fine sand-sized. Dolomite clasts are often found undergoing ductile deformation and compacted into available pore spaces. Observed diagenetic features include de-dolomitization into calcite, partial internal dissolution, and compaction.
At least traces of kaolinite were found in most thin sections (Fig. 11, also see Table 1). It was particularly abundant in the CSC and FD sections, comprising up to 10% of the rock. Kaolinite is presumed to be associated with feldspar dissolution, which may explain why less K-feldspar seems to occur in the southern part of the formation.
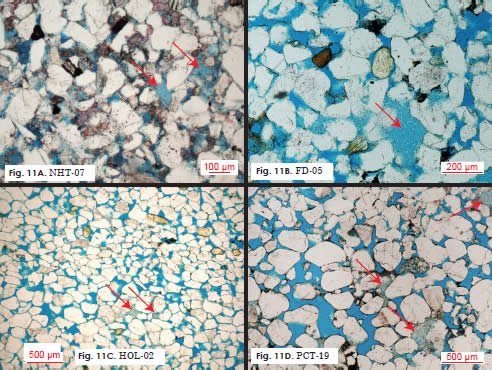
Fig. 11. Traces and minor percentages of kaolinite were found in almost every thin section studied (see Table 1 for details). Kaolinite is the light blue stippled mineral and is likely the product of altered feldspars.
Plagioclase was not very common in any of the thin sections, but it did occur as a trace mineral in some circumstances. It often exhibited partial dissolution. Nearly all slides contained trace amounts of tourmaline, zircon, and a black opaque mineral (probably magnetite). Generally these minerals were smaller in size than the quartz grains that surrounded them. Almost without exception, all of these grains were rounded to well-rounded. Some slides contained a brown rind that surrounded voids where a mineral grain had been dissolved; this is tentatively identified as illite. Many slides contained a black or brown organic-like material either in small patches or as material that lined voids where grains had been dissolved. Many slides contained stylolite-like features, parallel to bedding (Fig. 12). These stylolitic features were often highlighted by the black organic-like material. An examination of the data in Table 1 demonstrates that many of these minerals and textural features were present as traces throughout the thickness and lateral extent of the formation.
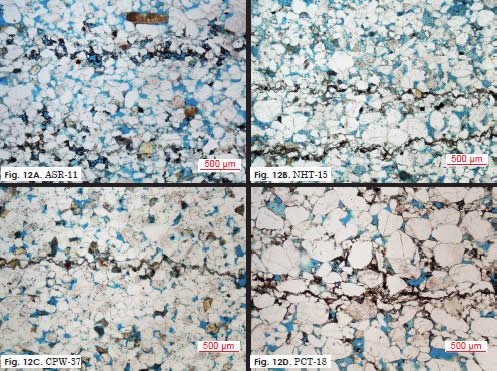
Fig. 12. Stylolite-like features occurred at many locations. They appeared as continuous to discontinuous black or brownish-black lines through the thin sections. Some dissolution could usually be found along the lines. We are not sure of the origin or composition of the dark material. It might be remnant organic material.
Grain size
Grains were measured from thin sections according to the techniques described in the methods section. It was found that there is a slight trend of increasing mean grain size from north to south (Fig. 13), the same general direction of cross-bed dips within the Coconino (Reiche 1938). McKee (1934) also noted this general trend. Smallest overall grains through a complete section were found at JUS with a mean Φ size of 3.42 (n = 5). Largest overall grains through a complete section were found at HOL with a mean Φ size of 2.76 (n = 5). Φ sizes in the 2 range are considered fine sand and Φ sizes in the 3 range are considered very fine sand. Thus the northern part of the Coconino is very fine sand, and the southern part is fine sand. Even though this is the overall trend, large grains (medium sand) are occasionally abundant in some thin sections in the northern part of the formation.
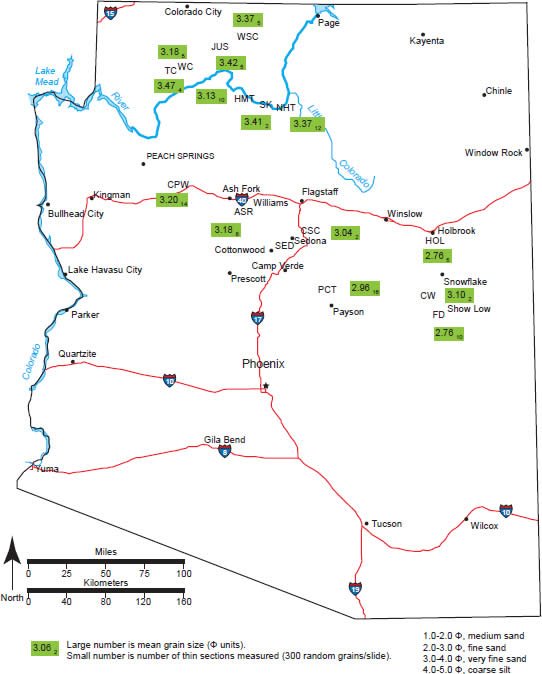
Fig. 13. Grain size map of mean grain sizes throughout the Coconino. Data can be found in Table 1. Grain size slightly increases from the northern part of the outcrop to the southern part of the outcrop.
Grain sorting
Grain sorting statistics were calculated according to the techniques described in the methods section. The most poorly sorted sands were found in the northern exposures of the Coconino; sorting generally improved toward the southern edges of the exposures (Fig. 14, Table 1). The best sorting through a complete section was found at CPW with a standard deviation of 0.61 (n = 14). The most poorly sorted section occurred at WC with a standard deviation of 0.94 (n = 5). Thus, the very best sorting we found in the Coconino was moderately sorted sand (0.61) at CPW. The least amount of sorting occurred at WC which was very poorly sorted (0.94). It is important to recognize that the outward appearance of the rock and cross-bedding style was essentially identical at all the sites. The Coconino should not be characterized as “well-sorted” according to the definitions of Johnson (1994). The Coconino’s mean grain size and sorting data from each of the studied thin section slides are plotted in Fig. 4. Our sorting results (from thin sections) compare well with those of Lundy (1973) who found that the Coconino was predominantly moderately sorted (from sieve data). Lundy’s results are reported in Fig. 15. Thin sections illustrating various sorting patterns in the Coconino are shown in Fig. 16.
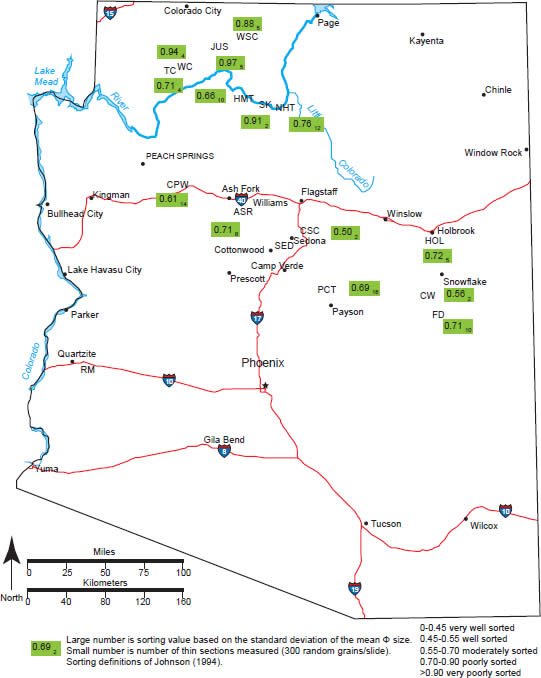
Fig. 14. Grain size sorting in the Coconino. Data can be found in Table 1. Sorting improves slightly from the northern to the southern part of the outcrop.
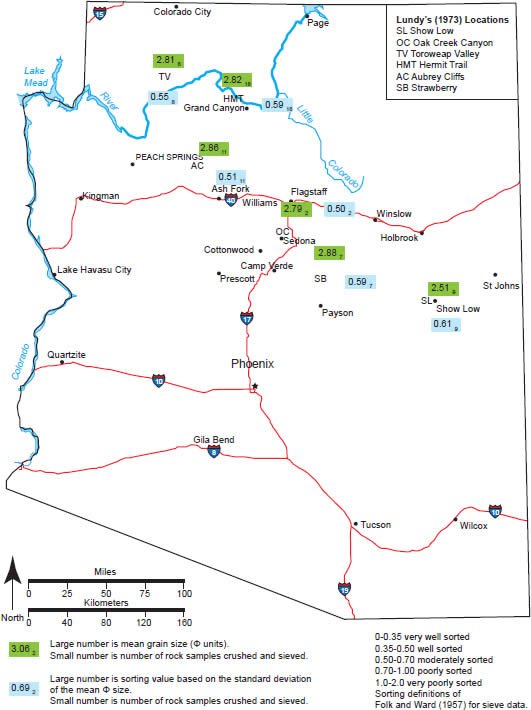
Fig. 15. Lundy’s (1973) grain size and sorting data for the Coconino based on disaggregating and sieving samples. We have not included some of his outcrops, since the Schnebly Hill Formation was not well defined in the southern part of the outcrop area when Lundy collected samples. We only included data that we thought certainly represented the Coconino Sandstone.
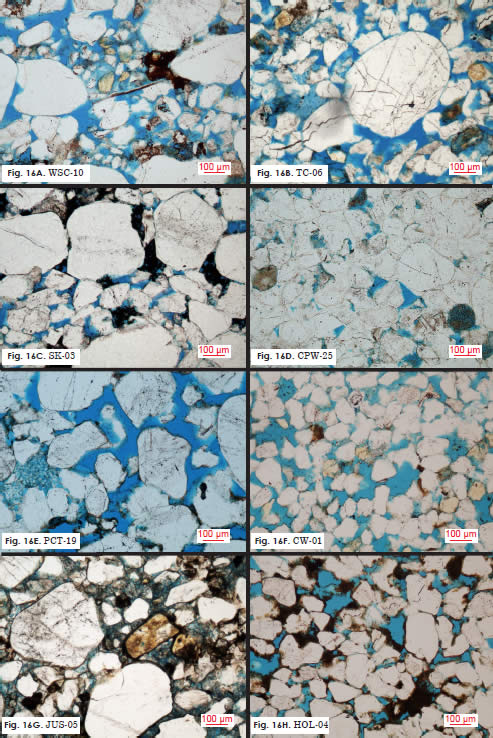
Fig. 16. A variety of thin sections showing various sorting patterns in the sand grains of the Coconino. Data can be found in Table 1. The slides had the following sorting measurements: WSC-10, σ = 0.88; TC-06, σ = 0.65; SK-03, σ = 1.08; CPW-25, σ = 0.65; PCT-19, σ = 0.70; CW-01, σ = 0.48; JUS-05, σ = 0.94; HOL-04, σ = 0.69. Sorting was slightly better in the southern part of the outcrop area, compared to the north.
Grain rounding
Grain rounding statistics were determined according to the techniques described in the methods section. In general, smaller grains tended to be more angular and larger grains tended to be more rounded; a feature that is noted in many different sedimentary environments. Our rounding results are reported in Fig. 17. The best rounded Coconino grains through a complete section occurred at CPW with a ρ value of 3.4. The most angular Coconino grains through a complete section occurred at WSC with a ρ value of 2.8. Thus, the Coconino should be characterized as being sub-angular to sub-rounded, not “well-rounded” (Fig. 18). It was noted that when K-feldspar occurs, it is often more angular than the surrounding quartz grains (Fig. 6).
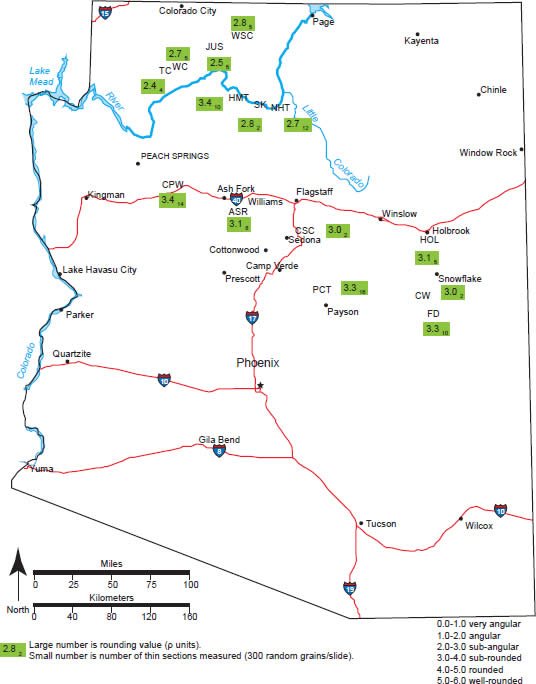
Fig. 17. Grain rounding map of the Coconino Sandstone. Rounding improves slightly from north to south.
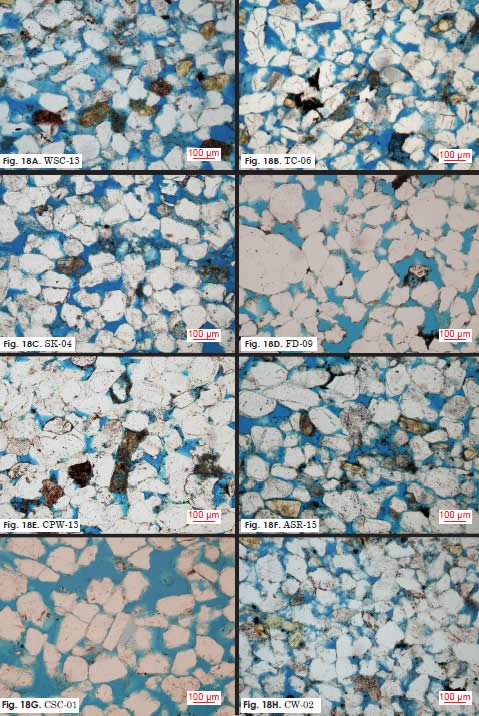
Fig. 18. A variety of thin sections showing various rounding patterns in the sand grains of the Coconino Sandstone. Note that only the largest grains (which are relatively rare) even approach being “well-rounded.” Most of the Coconino sand grains should be characterized as being sub-rounded or sub-angular. Smaller grains tended to be more angular than larger ones. K-feldspar was sometimes more angular than the surrounding quartz (as in 18E, 18F and Fig. 6). The slides had the following rounding measurements: WSC-13, ρ = 2.5; TC-06, ρ = 2.5; SK-04, ρ = 3.0; FD-09, ρ = 3.0; CPW-13, ρ = 3.5; ASR-15, ρ = 3.0; CSC-01, ρ = 2.5; CW-02, ρ = 3.5.
Frosting
When using a standard lens, Coconino grains do appear “frosted,” but it is exceptionally difficult to tell with certainty. Upon closer inspection of samples with a 30–40× binocular microscope, most of the grains (large and small) are frosted, but some are glassy and unfrosted (Fig. 19). Until now, no one has published any SEM photos of the Coconino (Fig. 20). Our SEM examination revealed that many grains are frosted, but the frosting does not have the appearance of being produced by eolian processes. Instead, it appears that most of the frosting was produced by dissolution of quartz, precipitation of quartz, and growth of various clay minerals. It should be noted that much of the Coconino is at least partially and often moderately to well-cemented by quartz, clays, and carbonate minerals. These cements largely mask original grain surfaces so observation of “frosted” surfaces may be severely impeded by the cements present.
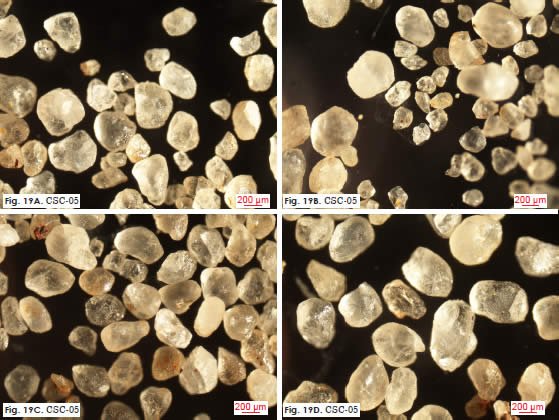
Fig. 19. Light microscope appearance of Coconino sand grains from CSC-05. In this set of photos many of the grains have been frosted. A few of the grains are more translucent and have not been frosted as much. The sandstone at this location was poorly lithified making grain separation easy.
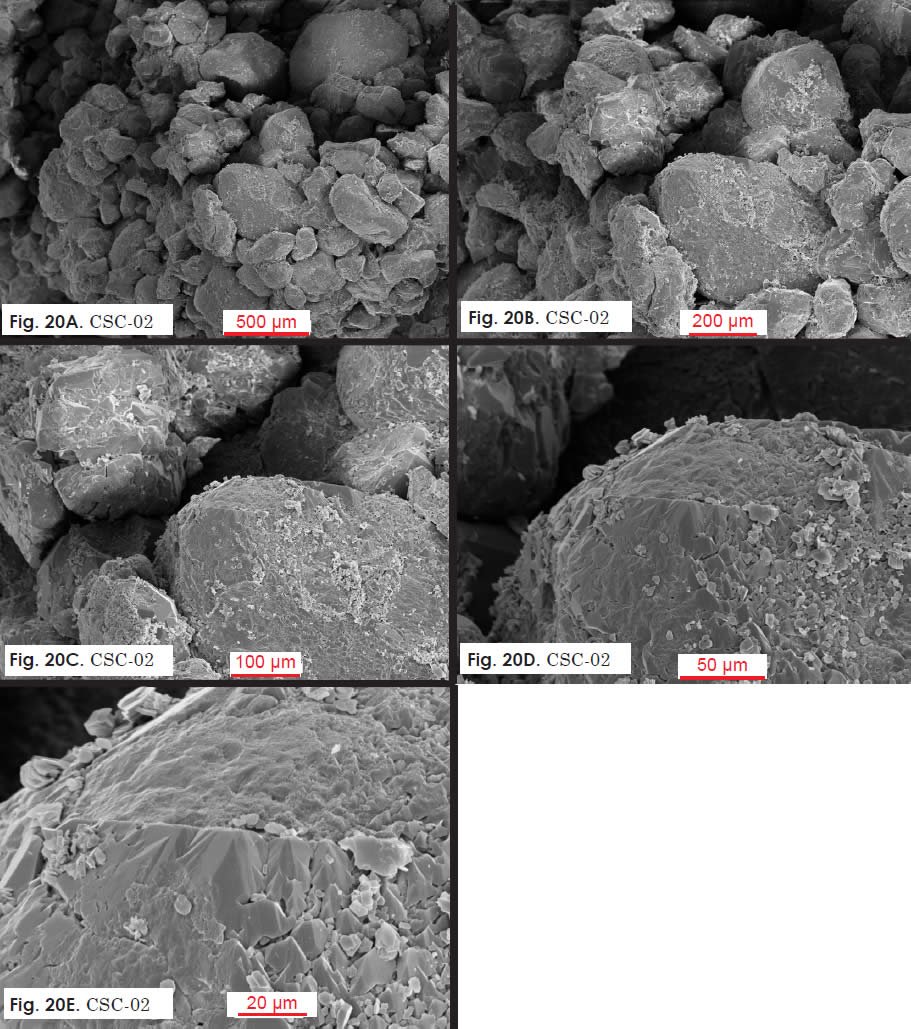
Fig. 20. SEM photographs of the Coconino Sandstone from CSC-02.
A. CSC-02 50× −01. This low magnification view displays the dull appearance that some of the more poorly lithified sands can have. Striking features of this image include the variation in grain sizes that are present as well as the variation in angularity in a single sample. Some grains are rounded (as at upper right) while other grains are angular in form. Grain sizes here range from around 700 μm to just over 100 μm in the long axis.
B. CSC-02 100×−02. At this magnification, one can begin to see why the rock has a dull appearance. Small particulates in the form of overgrowths and clays create a highly irregular surface. Again, the variation in grain size is notable. Even though poorly to moderately cemented, you can see quartz overgrowths present on many of the grains. Porosity is well connected in this rock.
C. CSC-02 200× −03. Large pores in this view, create ample opportunity for grain overgrowths. As a result, most of the grain surfaces are covered with a variety of materials. Quartz cement is again ubiquitous in the rock and in this particular sample authigenic kaolinite clay coats many of the grains as a “dirty” surface as at lower left. The large grain at lower right is significantly overgrown by fields of micro-crystalline quartz. As a result, the true surfaces of the grains are covered or masked by these overgrowths. Large, flat quartz crystal faces as at lower left will reflect light brilliantly.
D. CSC-02 500× −04. A higher magnification of the previous photo reveals several features of interest. In mid-lower right, one can see multiple overgrowths of quartz cement. Just above the micron marker, kaolinite clay is present as single pseudo-hexagonal plates and booklets. This habit is typical of kaolinite. The upper part of this grain also has kaolinite clinging to its surface. Just above mid-image is a surface that is probably original in texture. It is moderately rough and exhibits some pitting that curiously shows what are V-shaped pits typical of fluvial environments and some possible upturned plates which may be ascribed to eolian processes. This mixture of pitting characteristics calls into question a purely eolian depositional environment.
E. CSC-02 1000× −05. A still higher magnification of the previous photo reveals further features of interest. In mid-lower-right, one can see multiple overgrowths of quartz cement. Just around the micron marker, kaolinite clay is present as single pseudo-hexagonal plates and booklets. The upper part of this grain also has kaolinite clinging to its surface. Just above mid-image is a surface that is probably original in texture. At this magnification, its overall surface appears to be chemically corroded. It is moderately rough and exhibits some pitting that curiously shows what are V-shaped pits typical of fluvial environments and some possible upturned plates which, again, may be ascribed to eolian processes. This mixture of pitting characteristics calls into question a purely eolian depositional environment.
Textural parameters of modern eolian sands
The plot of sorting versus grain size for modern wind-blown sands is shown in Fig. 4A. The plot shows that modern wind-blown sands, in the same size range of the Coconino (2.8–3.4 Φ) tend to be well- to very well-sorted.
Discussion
Measurement techniques
Previous workers have used disaggregation techniques to study the sorting of the Coconino (Lundy 1973; Fig. 15). We chose to measure the grain size characteristics via thin section studies. The advantage of disaggregation techniques is that they are directly comparable to sieve data. However, we feel there is a chance that disaggregating well-cemented sandstones will lead to an increased fine fraction because of grain and cement fractures. Some of the grains may also be a bit larger because of cement that sticks to them. Measuring grains with a microscope and then converting the data to sieve values has its own challenges because weight percent data are not generated (as in sieve data); number percent data are generated instead. This topic has been discussed in the literature for decades (Adams 1977; Folk 1966; Friedman 1958, 1996; Galehouse 1971; Harrell and Eriksson 1979; Krumbein 1935; Packham 1955; Sahu 1966) and there does not appear to be general agreement on how to convert the data from one form to another. We chose to use Johnson’s (1994) definitions for thin section sorting since it is one of the most recent papers dealing with this topic and it takes the long axis measurements and ellipsoidal grains into account. Our data show that grain size slightly increases to the south, which is in agreement with what others have found (McKee 1934). Trends in our sorting data are not as clear, but it appears sorting may improve slightly to the south. Lundy’s data from sieve statistics, which generally agree with our thin section data, showed the Coconino was moderately sorted throughout (Fig. 15).
There are several techniques that can be used to count and measure grains under the microscope (Galehouse 1971). Older techniques (before digital cameras and the ability to project the microscope image on a screen) involved measuring grains along a line or at the intersections of lines on a grid. The problem with this technique is that it is biased toward larger grains (Sahu 1976; Van der Plas 1962) because larger grains are statistically more likely to intersect the line or the grid than smaller ones. Our method is a variation of ribbon counting developed by Van der Plas (1962). Instead of measuring grains along a narrow ribbon across the whole slide, we measured grains in selected “fields of view” in predetermined areas of the slide. Modern microscopes with images projected on a computer screen and software measurement tools make measuring entire fields of view very easy. In the process of measuring a grain, it is marked so re-counting will not occur and there is the assurance that every grain is measured. Johnson (1994) demonstrated that measuring the long axes of ellipsoidal grains in thin section only slightly overestimates true grain size. He suggested adding a correction factor of 0.05 Φ to uncorrected long axes measurements or multiplying uncorrected axis lengths by 0.95 in the case of mm values. Thus, he found that long axis measurements of ellipsoidal grains made under the microscope are closely related to true grain diameters.
Lack of compaction
A quartz grain that is compacted, particularly in the vertical, will create undulose extinction as it is deformed. Most quartz grains show uniform extinction in the Coconino. This is an important observation because it indicates that very little vertical compaction has occurred in the Coconino. Thus, cross-bed dips should be close to their original angles of repose and have been minimally reduced by compaction (Emery, Maithel, and Whitmore 2011). Micas are generally not deformed or bent (Fig. 7) and dolomite ooids, which should be easily deformable, compared to the quartz grains, are nearly spherical in all locations in which they were found (Fig. 10). Another feature often caused by compaction is grain-suturing. Occasionally, quartz grains are sutured, creating indentation or micro-stylolites. These micro-stylolites are rare in the Coconino, and also indicate little compaction has occurred. Many slides contained black stylolite-like features, parallel to bedding (Fig. 12). It should be noted that because these features are parallel to bedding, it is additional evidence that only minor amounts of compaction have occurred. Of course, the high porosity of the sandstone (pore space is blue in our thin sections), with only minor amounts of dissolution, also indicates very little compaction has taken place.
Mineral composition
Micas are generally not expected in eolian deposits (Moorhouse 1959, p. 343; Tucker 1981, p. 45) probably because of their hardness when compared to quartz (biotite = 2.5, muscovite = 2.5–3.0, quartz = 7.0) and the ease with which the grains can flake apart due to the basal cleavage of these minerals. It is generally not expected that minerals like this would survive very well in an abrasive eolian environment, but would survive better in subaqueous situations where water provides a buffer (Anderson et al. 2013). In our studies, we have rarely found mica in modern eolian settings. It only occurred when the dunes were relatively small and were in the immediate proximity of igneous bedrock hosting micas; a scenario which cannot be argued for the Coconino. We have been unable to locate micas in thin sections obtained from large modern dune fields like the Nebraska Sand Hills, despite extensive searching. Micas are, however, known for their presence in offshore sands. They tend to be more common in distal sands than in coarser-grained proximal sands (Pettijohn, Potter, and Siever 1973, p. 39). The micas in the Coconino occur only as trace minerals, but they are present vertically and laterally throughout the formation. The presence of micas is difficult to reconcile with an eolian origin of the Coconino.
Dolomite is mainly associated with marine depositional environments, and occurs only rarely in any modern depositional settings (Bontognali et al. 2010). The formation of dolomite is a subject of considerable controversy in the geologic literature. The purpose of this portion of the paper is not to resolve that controversy. However, what is currently known about the origin of dolomite places some constraints on dolomite crystallization in the Coconino. These constraints determine whether or not an eolian environment can promote and sustain the formation of dolomite in the Coconino. Fundamentally, dolomite formation is a wet chemical process (Lippman 1973), that involves overcoming kinetic barriers either with high temperatures (> 100°C) and/or high pressures (Arvidson and Mackenzie 1999). It requires advection (Machel 2004) and a constant and sufficient supply of Mg2+ and CO32- (Morrow 1988). These conditions must all be met in order for dolomite to form.
The rock samples containing dolomitic ooids, as mentioned previously, occur only in the cross-bedded units. Ooids are attributed to marine or lacustrine environments and are commonly found in tidal deltas, bars, or beaches (Scholle and Ulmer-Scholle 2003). In the oolitic-rich cross-beds found in our study area, most of the primary porosity is retained with little dolomitic cement occupying intergranular porosity. The interstitial porosity between the sucrosic dolomite crystals in the crystal fabric is open. This lack of dolomitization of the primary porosity and remnant interstitial porosity may suggest that dolomite is a primary rather than replacive mineral. The possibility of secondary dolomitization was considered. However, the selectivity of the dolomitization (only outer layers of ooids were replaced with no replacement of intergranular porosity) and the retention of original fine textures (concentric alternating layers down to microcrystalline thickness are clearly visible in some ooids) is more diagnostic of a primary carbonate. Studies done on ooid growth indicate that concentric layers associated with ooids are not a diagenetic feature but rather a primary texture resulting from the process of ooid formation (Heller, Komar, and Pevear 1980). In these studies, ooids exhibiting concentric textures and diameters greater than 0.6 mm (.02 in) were calculated to have formed in a 40 to 120 cm s-1 paleocurrent, which has been confirmed by observations in modern environments of ooid formation. Other studies have also indicated a far more complex process of ooid formation, in which factors such as supersaturation of CaCO3, the presence of nuclei, current agitation, location, and water depth all play a role (Davies, Bubela, and Ferguson 1978; Simone 1981). In these studies, ooid formation comprises several cyclical stages, evidenced by the many layers in the ooid. The consensus is that ooids require a marine environment with specific kinetic/ chemical conditions, with regular “maintenance” to sustain growth. Nevertheless, instances of primary dolomitic ooids are not well documented (Simone 1981) and most ooids are believed to be calcitic in origin. Therefore it is difficult to say with absolute certainty that these dolomitic ooids are in fact primary, although the observed textures appear to be consistent with a primary depositional origin. As previously noted, some of the ooids rarely show slight signs of compaction, including delamination of individual layers and overall distortion sub-parallel to bedding. A study by Chatalov (2003) indicates that the soft-sediment deformation of ooids occurs during early diagenesis. Therefore, if the Coconino ooids were transported into and deposited in an eolian environment, it must have happened while some of the ooids were not fully lithified. This is difficult to envisage bearing in mind the fragility of these ooids. The ooids show few if any signs of physical abrasion and no signs of mechanical failure (i.e. broken ooids). Under conditions of eolian transport, the medium to coarse sand-sized quartz grains found neighboring the ooids should have abraded or broken the ooids during saltation. Dolomite has a hardness of 4 (Mohs scale) and quartz and feldspar have hardnesses of 7 and 6 (respectively). Assuming that these grains had been transported by saltation in an eolian environment, we would expect the dolomite to have an equal or finer grain-size on average than the quartz and feldspar grains. However, this is not the case. The dolomitic ooids are typically coarser grained (fine to medium sand-sized) than the average quartz and feldspar grains (silt to very fine sand-sized). Furthermore, the ooids found in the Coconino lack the textural features expected to have developed under conditions of eolian transport. It is important to note that the ooids are found in typical Coconino tabular cross-bedded units, which do not vary in style throughout the formation implying the whole formation was formed by similar processes. The observed features and distribution of the ooids appear to be at odds with an eolian interpretation.
The dolomite clasts, which are rounded and composed of microcrystalline dolomite, probably originated from the bedded dolomites in the north. The clasts vary in size and can be up to granule-size (~2 mm [0.07 in]), as in WSC. This is a surprising discovery, since the neighboring quartz and feldspar grains are smaller (medium to fine sand-sized). This is characteristic of most of the dolomite clasts found in the Coconino, where their grain-size is much larger than the neighboring (and much harder) quartz and feldspar grains. Again, these were found in tabular cross-bedded units.
Dolomite cements represent an authigenic in situ precipitation of dolomite. These rhombs vary in size and may be as much as 500 μm across. Some rhombs are found in different stages of de-dolomitization into calcite (which is less thermodynamically stable than dolomite) and varying states of dissolution. As mentioned previously, different textures of dolomite cements are present and each indicates a different generation of dolomite cement precipitation. Together these data indicate multiple diagenetic events occurring in the Coconino and precipitating and destabilizing the dolomite. The specific conditions for dolomite precipitation must be met for each generation of dolomite precipitation.
Dolomite beds have been found at AP and BSG within the Coconino. At HC the probable cross-bedded sandstone unit that correlates with the Coconino (about 0.5 m [1.6 ft] thick) is also directly associated with dolomite. The Scherrer Formation in southeastern Arizona (a probable equivalent of the Coconino) also contains dolomite beds. The beds in the Coconino are found to be very pure (up to 98% dolomite) and might be correlative for more than 100 km (62 mi) at the base of the formation in the northernmost part of its outcrop. High purities of dolomite are unexpected in an eolian environment, since sand could easily blow into interdunal ponds and contaminate the dolomite. Interdunal ponds are insufficient to explain the purity of the dolomite and the regional extent of the beds.
Grain size
Studies by Reiche (1938) and our cross-bed measurements (n = 214) indicate that transport directions within the Coconino are roughly from north to south. Grain size increases within the unit from north to south (Fig. 13). In modern deserts, grain size typically follows the opposite pattern; grain sizes diminish with wind transport (Crouvi et al. 2008; Jerolmack and Brzinski 2010; Lancaster 1995; Pye and Tsoar 2009; Smalley and Vita-Finzi 1968; Wright 2001). This suggests that if the Coconino is an eolian deposit, it is highly unusual; or that a different depositional mechanism deposited the sand.
Grain sorting
We were surprised to find that the Coconino was not better sorted than we observed. When examining the very fine-grained sandstone with a hand lens in the field, it does appear well-sorted, but only the larger quartz grains are seen under these circumstances since it is so fine grained. We suspect this is why most authors have reported the Coconino as being “well-sorted.” However, when studying thin sections under the microscope, smaller grains become apparent between the larger ones. As far as we know, there are no published thin sections of the Coconino with the exception of four photographs that appeared in Lundy’s thesis (1973) and a few that we recently published from the base of the Coconino (Whitmore and Strom 2010). This may explain why this feature of the Coconino has hitherto gone unnoticed.
We plotted Ahlbrandt’s data (1979) along with ours from modern eolian dunes, a total of 519 samples. It is clear that modern eolian sands within the size range of the Coconino (2.8–3.4 Φ) tend to be well- to very well-sorted. By contrast, a similar graph based on Coconino samples (Fig. 4B) shows that it is mostly moderately sorted and above the range of similar modern sands. It is important to realize that Fig. 4A consists of results from sieve data and Fig. 4B consists of results from thin section data. The two types of data are not directly comparable, as noted previously. Much has been written on the topic over the past 70 years and a number of conversion factors have been suggested. It seems that there are reliable conversion factors for means, but sorting conversion factors (standard deviations) are not as reliable (Friedman 1962; Johnson 1994). Thus, we compare the Coconino sorting to modern dunes using Johnson’s (1994) definitions for thin section sorting and Folk and Ward’s (1957) definitions for sieve samples. Using these definitions, it does not appear that the Coconino is as well-sorted as most modern dune sands within the size range for the Coconino. Modern dune sands are occasionally poorly sorted, but these sands usually occur in interdunal areas or in planar-bedded areas around the perimeter of the dune field, not on cross-bed slip faces. All of the Coconino samples were taken from dipping cross-beds which presumably represent the slip faces of dunes. It appears that sorting in the Coconino is not comparable to the sorting in modern dunes, but additional knowledge on how to convert thin section data to sieve data is needed. It does not appear that anyone has arrived at a satisfactory solution to this problem in the literature. Nevertheless, the absence of well-sorted sand in the Coconino may indicate something other than an eolian origin. Lundy (1973) obtained sorting data by disaggregating and sieving the Coconino (Fig. 15); his results show the Coconino is “moderately sorted” according to Folk and Ward’s (1957) definitions. His sieving results were similar to our thin section results, which gives us some confidence our thin section sorting statistics are within range of the correct value.
Grain rounding
It is not unusual for eolian sands to be slightly angular, especially in the finer sand classes. We have found this from our own examination of many modern eolian sands collected in both inland and coastal settings across the United States. In Khalaf and Gharib’s study (1985) of eolian quartz sand grains from Kuwait, they found that the best rounded grains were about 1.0 Φ in diameter and then rounding steadily dropped off, with the most angular grains being about 3.5 Φ. It seems that there is a general misconception among geologists that all eolian sands are rounded or well-rounded (Pye and Tsoar 2009). Many desert sands can be angular or sub-angular. For example, quartz sand grains from the Simpson Desert in Australia are sub-angular to angular (Folk 1978). Folk suggested that this was because “there is apparently not enough repeated grain transport to accomplish observable abrasion” (p. 621). Goudie et al. (1987, p. 249) stated: “The tendency for desert dune grains to be sub-rounded and sub-angular rather than rounded, though contrary to widespread belief, is now well established.” They published the rounding results from 106 dune samples from seven dune fields around the world (their Table VI); the mean percentage of rounded and well-rounded grains in the 2.5 Φ fraction was only 9.64%.
Bearing in mind the angularity of many modern eolian sands, it may not be surprising that most quartz grains in the Coconino are in the sub-angular to sub-rounded range. However, what is surprising is that angular K-feldspar grains can often be found intermixed with better rounded quartz grains (Fig. 6). On Mohs scale of hardness, K-feldspar has a hardness of 6.0, and quartz has a hardness of 7.0. K-feldspar is also less resistant to abrasion than quartz based on experiments by Thiel (1940). In our studies of Oregon beach and coastal dune sands, we found that K-feldspars are slightly more rounded in dune sands compared to beach sands, probably indicating eolian abrasion over a saltation distance of only hundreds of meters (McMaster, Whitmore, and Strom 2010).
Whatever the transportation mechanism that deposited the Coconino, it seems that K-feldspar grains should be more rounded than the quartz grains based on the fact that they are softer and less resistant to abrasion. The more angular nature of the K-feldspar (and the presence of other minerals such as micas) may indicate more than one source of sand for the Coconino. If the source(s) for the micas and the K-feldspars were granitic rocks, there are no obvious nearby potential sources. Interestingly, Gehrels et al. (2011, p. 197) concluded from the dating of zircons within the Permian sequence of the Grand Canyon that most of the sand was carried by large rivers across the continent from the Appalachian region (> 3000 km [1864 mi]) and then reworked into widespread eolian units, including the Coconino. If these sediment grains were transported to the area by rivers and then by eolian processes over such great distances, it is hard to imagine how minerals like mica survived and why the K-feldspars are less rounded than the quartz.
Frosting
Many have claimed that the Coconino is “frosted” (Baars 2000; McKee 1934; Ranney 2001; Rascoe and Baars 1972; Strahler 1999; Weber 1980; Young and Stearley 2008). Many desert sands are frosted and most assume this is because of grain-to-grain collisions which cause small pits and blemishes on the sand grains giving them a dull, whitish appearance. None of the authors cited above indicate how they determined the Coconino was frosted; so we suspect that they simply used a standard loupe, a low power microscope, based their conclusions on what others said, or just assumed it was frosted because of the assumption of an eolian origin.
McKee (1934, pp. 96, 116) recognized that frosted grains did not necessarily prove an eolian origin. After all, grains could be frosted by eolian processes and then transported to a marine setting. There is also the problem of reworking, where grains have undergone one or more episodes of recycling and have inherited features from previous depositional regimes (McKee 1934, p. 96; Selley 1985, pp. 91–92). Rounding, sorting, surface textures, and even faceted pebbles can be inherited in this way. Nor is the frosting of grains clearly diagnostic of eolian conditions because it can be produced in other depositional environments (Shepard and Young 1961) and by diagenetic processes (Selley 1985, p. 91). Lundy (1973, p. 52) argued that the frosting of Coconino sand grains was probably the result of corrosion and pressure solution during diagenesis.
An examination of the literature on frosting demonstrates that grain-to-grain collisions may not always cause the expected results and that there are many other causes for frosting. In most modern deserts only larger grains are usually frosted (> 300 μm according to Pye and Tsoar 2009). The mean grain size of the Coconino is well below this threshold, somewhere between 90 to 148 μm (3.47 to 2.76 Φ, see Table 1). It is thought that smaller grains probably do not have the momentum to cause frosting from grain collisions, thus smaller grains are not as well frosted as the larger ones (via mechanical processes). Kuenen and Perdok (1962, p. 649) found in their studies that frosting becomes less pronounced over a range of sizes between 500 to 150 μm (the percentage of frosted grains decreasing from one hundred to zero). Thus the Coconino sand grains are probably too small to be extensively frosted from grain-to-grain collisions. Kuenen and Perdok (1962) believe that grain-to-grain collisions only play a very minor role in frosting. They believe that most frosting (and defrosting) is caused by chemical etching of the quartz grains. They cite field evidence and laboratory experiments in support of this hypothesis. In studying 20 desert and coastal dune environments from around the world, Margolis and Krinsley (1971) found that chemical solution and desert dew can be major causes not only of frosting, but rounding of sand grains as well. For whatever reason, most eolian deposits do contain frosted grains, but significant amounts of frosting are probably produced by processes other than grain-to-grain collisions. It is important to remember that in modern deserts typically only the coarser sand grains are frosted; sands in the size range of the Coconino are not. Thus, frosting should not be used as a definitive eolian criterion as so many have tried to do (Swezey 1998). Interestingly, an SEM study of the Navajo Sandstone, another supposed ancient eolian unit, concluded that none of the frosting on its grains could be attributed to mechanical action; it was all related to chemical processes (Marzolf 1976). High porosity sandstones are particularly susceptible to chemical attack because groundwater can move so easily through them.
Research on how frosting forms, even in deserts, has shifted away from mechanical processes and is thought to predominantly be caused by chemical processes (Krinsley and Smalley 1972; Kuenen and Perdok 1962; Margolis and Krinsley 1971; Marzolf 1976; Walker 1957). Walker (1957) identifies five processes that can cause frosting: 1) sandblasting, 2) differential solution of grain surfaces by groundwater, 3) incipient quartz overgrowths, 4) pressure solution along contacts between adjacent grains, and 5) carbonate replacement of quartz along grain boundaries. Any of these processes could potentially cause any of the frosting present in the Coconino. Grain-to-grain collisions (sandblasting) typically only produces faint and shallow frosting, along the edges of grains and is normally very difficult to see without significant magnification. Chemical processes usually cause frosting that is more defined—frosting that covers entire grain surfaces and that is easier to see at lower magnifications. Our SEM studies (albeit on a limited number of samples) indicate Coconino frosting is primarily chemical in origin.
In a section dealing with “Quartz Arenite Myths” Dott (2003, p. 390) sums up the current consensus on the eolian origin of frosting:
The frosting or micro-roughness of sand grains is now known to have several causes besides wind abrasion. Kuenen and Perdok (1962) demonstrated the importance of chemical dissolution as a major cause, which dis-credited the longstanding myth that frosting proved eolian abrasion. The scanning electron microscope (SEM), while confirming the importance of solution, has also revealed minute precipitates on grains as another cause of a frosted luster. Moreover, the SEM has shown that different processes of abrasion tend to produce distinctive micro-patterns and that frosting is not characteristic of eolian sands (fig. 4 of Krinsley and Doornkamp 1973). These surface textures coupled with Fourier shape analysis have been used to discriminate changes of process or deposition in seemingly monotonous quartz arenites (Mazzullo and Ehrlich 1980, 1983).
Thus, frosting should not be used as definitive evidence for the eolian origin of the Coconino or any other sandstone. Frosting has been demonstrated to form in too many other ways and our SEM studies indicate that a good portion of the frosting present in the Coconino is due to the dissolution and re-precipitation of silica.
Conclusions
A close examination of the petrology of the Coconino Sandstone yields data that is hard to reconcile with the standard eolian depositional model. The mineralogy of the formation is quite unexpected. Mica occurs in almost every thin section studied as trace amounts, and is found throughout the formation both laterally and vertically. It is difficult to understand how mica could survive an abrasive eolian climate, particularly when long distance transport is invoked. K-feldspar occurs frequently throughout the formation and, even though it is softer than quartz, it is often more angular. Our studies show that K-feldspar is rounded quickly in eolian settings even in the short transport from a beach to a coastal dune setting (McMaster, Whitmore, and Strom 2010) and that micas have little chance surviving abrasive eolian conditions (Anderson et al. 2013). We suggest the K-feldspar and mica may be relatively immature because they were transported by water instead of wind. We have also documented the occurrence of widespread dolomite over roughly half of the Coconino outcrop area in Arizona. Dolomite occurs as beds, ooids in cross-bedded units, cements, and as large clasts. Although the dolomite tends to occur near the base and top of the formation, it appears to be of marine origin, primary in nature and not a replacement for calcite.
Although modern desert sand dunes may contain rather poorly sorted sand at times, that sand tends to occur in planar-bedded interdunal deposits and other deposits around the perimeter of the dune field. Nearly all of our rock samples were collected from what are presumed to be the avalanche slopes of ancient desert dunes. In modern dunes these deposits are widely recognized to be well-sorted. Our studies, combined with those of Ahlbrandt (1979), show that modern eolian sands in the size range of the Coconino (fine sand) tend to be well- to very well-sorted (Fig. 4A). The sorting in the Coconino falls at the upper edge of this range (compare Fig. 4A with Fig. 4B). We have also documented that grain size tends to increase from the northern part of the formation to the southern part; opposite to what usually occurs in modern deserts.
Some have used grain frosting as an obvious indicator that the Coconino is eolian in origin. However, the Coconino sand grains are too small to be frosted by mechanical means; they just would not have enough mass to become frosted as a result of grain-to-grain collisions in an eolian environment. Our SEM results show that the frosting is a result of chemical growth on the grains, not mechanical collisions. If any mechanical frosting is present, it would be obscured by the frosting that developed chemically. Additionally, the geological consensus seems to be shifting toward the belief that most frosting is caused chemically, not mechanically. Thus, the frosted grains in the Coconino are not definitive evidence for eolian origin.
Several previous workers have suggested subaqueous deposition for at least parts of the Coconino. When McKee wrote his monograph in 1934, he suggested that part of the Coconino was water-laid (see pp. 79, 110), referring to planar Coconino beds that can be found at the transitional contact between the Hermit and Coconino along Tanner Trail in the Grand Canyon. Fisher (1961, p. 81) thought the Coconino was marine in the area of the Shivwits Plateau because of the transitional nature with the marine Toroweap Formation. Brand (1979) and Brand and Tang (1991) suggested that the cross-bedded portion of the Coconino was subaqueously deposited because of the unusual characteristics of vertebrate tracks on dune foresets that were difficult to explain in dry or wet subaerial sand (but see also the discussion of Lockley [1992] and Brand [1992]). Lundy (1973) came to the conclusion that the Coconino was deposited by subaqueous sand waves. Peirce, Jones, and Rogers (1977, p. 17) thought that the Coconino in east central Arizona was marine because of the planar bedding style predominant in that area. Recently, we have reported the occurrence of soft sediment deformation features in the Coconino that in all ways resemble parabolic recumbent folds (Whitmore, Forsythe, and Garner 2012, 2015) and which suggest a subaqueous environment for the deposition of the cross-beds in which they are found.
Defending a new depositional model for the Coconino is outside the scope of this paper; our primary purpose is to report the petrographic data. However, we think the sand wave model first proposed by Lundy in his thesis (1973) deserves reconsideration. Sand waves are large dune forms that are well-known on the continental shelf in areas of strong currents (Barnard et al. 2006; Garner and Whitmore 2011) and may adequately explain the large cross-beds that predominate in the Coconino. Such a model can incorporate all of the petrographic data we have found and could easily explain the marine facies changes the Coconino exhibits both vertically and laterally. Besides the bedded dolomite that we have documented at the base of the Coconino along the northern edge of its outcrop, the Coconino is known to grade laterally into the Glorieta Sandstone in New Mexico, which has long been considered to be marine (Baars 1961). It is also suspected the marine Scherrer Formation in southeastern Arizona is a Coconino equivalent. Vertically the Coconino grades into the marine Toroweap Formation in many locations (Turner 2003) and, along the northern edge and southern edges of the Coconino, it appears to grade laterally into the marine Toroweap as well (Rawson and Turner-Peterson 1980; Sorauf 1962). The results of this study should encourage new sedimentological studies of the Coconino and modern sand wave complexes to see if our sand wave hypothesis has any credence.
Acknowledgments
We would like to thank Calgary Rock and Materials Services Inc., private contributors, Cedarville University and the Institute for Creation Research for funding and logistical support. We thank Grand Canyon National Park for allowing us to collect samples along the Hermit, New Hance and South Kaibab Trails (Permits GRCA-2005-SCI-0011 &\ and GRCA-2010-SCI-0039). We also wish to thank Mr. Robert Schumacher of Cedarville University for helping us with our statistical data and plots using the R Software Package.
References
Adams, J. 1977. Sieve size statistics from grain measurement. Journal of Geology 85, no. 2:209–227.
Ahlbrandt, T. S. 1979. Textural parameters of eolian deposits. In A study of global sand seas, ed. E. D. McKee, 21–51. US Geological Survey Professional Paper 1052.
Anderson, C. J., A. Struble, J. H. Whitmore, and M. Cheney. 2013. Micas in cross-bedded sandstones and their abrasional trends. Geological Society of America Abstracts with Programs 45, no. 7:128.
Arvidson, R. S., and F. T. Mackenzie. 1999. The dolomite problem; control of precipitation kinetics by temperature and saturation state. American Journal of Science 299, no. 4:257–288.
Baars, D. L. 1961. Permian blanket sandstones of the Colorado Plateau. In Geometry of sandstone bodies, ed. J. A. Peterson and J. C. Osmond, 179–207. Tulsa, Oklahoma: American Association of Petroleum Geologists.
Baars, D. L. 2000. The Colorado Plateau. Albuquerque, New Mexico: University of New Mexico Press.
Barnard, P. L., D. M. Hanes, D. M. Rubin, and R. G. Kvitek. 2006. Giant sand waves at the mouth of San Francisco Bay. Eos Transactions of the AGU 87, no. 29:285–289.
Bontognali, T. R. R., C. Vasconcelos, R. J. Warthmann, S. M. Bernasconi, C. Dupraz, C. J. Strohmenger, and J. A. McKenzie. 2010. Dolomite formation within microbial mats in the coastal sabkha of Abu Dhabi (United Arab Emirates). Sedimentology 57, no. 3:824–844.
Brand, L. 1979. Field and laboratory studies on the Coconino Sandstone (Permian) vertebrate footprints and their paleoecological implications. Palaeogeography, Palaeoclimatology, Palaeoecology 28:25–38.
Brand, L. R. 1992. Fossil vertebrate footprints in the Coconino Sandstone (Permian) of northern Arizona: Evidence for underwater origin: reply. Geology 20, no. 7:668–669.
Brand, L. R., and T. Tang. 1991. Fossil vertebrate footprints in the Coconino Sandstone (Permian) of northern Arizona: evidence for underwater origin. Geology 19. no. 12:1201–1204.
Brill, K. G. Jr. 1952. Stratigraphy in the Permo-Pennsylvanian zeugogeosyncline of Colorado and northern New Mexico. Bulletin of the Geological Society of America 63, no. 8:809–880.
Chatalov, A. G. 2003. On the origin of distorted ooids in the Triassic limestones from northwestern Bulgaria. Comptes rendus de l’Académie bulgare des Sciences 56, no. 10:63–68.
Crouvi, O., R. Amit, Y. Enzel, N. Porat, and A. Sandler. 2008. Sand dunes as a major proximal dust source for late Pleistocene loess in the Negev Desert, Israel. Quaternary Research 70, no. 2:275–282.
Davies, P. J., B. Bubela, and J. Ferguson. 1978. The formation of ooids. Sedimentology 25, no. 5:703–729.
Dimelow, T. E. 1972. Stratigraphy and petroleum, Lyons Sandstone, northeastern Colorado. MS Thesis. Golden, Colorado: Colorado School of Mines.
Dott, R. H. Jr. 2003. The importance of eolian abrasion in supermature quartz sandstones and the paradox of weathering on vegetation-free landscapes. Journal of Geology 111, no. 4:387–405.
Driese, S. G. 1985. Interdune pond carbonates, Weber Sandstone (Pennsylvanian-Permian), northern Utah and Colorado. Journal of Sedimentary Petrology 55, no. 2:187–195.
Emery, M., S. Maithel, and J. H. Whitmore. 2011. Can compaction account for lower-than-expected cross-bed dips in the Coconino Sandstone (Permian), Arizona? Geological Society of America Abstracts with Programs 43, no. 5:430.
Fisher, W. L. 1961. Upper Paleozoic and lower Mesozoic stratigraphy of Parashant and Andrus Canyons, Mohave County, northeastern Arizona. PhD Thesis. Lawrence, Kansas: University of Kansas.
Folk, R. L. 1955. Student operator error in determination of roundness, sphericity, and grain size. Journal of Sedimentary Petrology 25, no. 4:297–301.
Folk, R. L. 1966. A review of grain-size parameters. Sedimentology 6, no. 2:73–93.
Folk, R. L. 1978. Angularity and silica coatings of Simpson Desert sand grains, Northern Territory, Australia. Journal of Sedimentary Petrology 48, no. 2:611–624.
Folk, R. L., and W. C. Ward. 1957. Brazos River bar: a study in the significance of grain size parameters. Journal of Sedimentary Petrology 27, no. 1:3–26.
Friedman, G. M. 1958. Determination of sieve-size distribution from thin-section data for sedimentary petrological studies. Journal of Geology 66, no. 4:394–416.
Friedman, G. M. 1962. Comparison of moment measures for sieving and thin-section data in sedimentary petrological studies. Journal of Sedimentary Petrology 32, no. 1:15–25.
Friedman, G. M. 1996. Thin section grain size analysis revisited. Sedimentology 43, no. 1:189–191.
Galehouse, J. S. 1971. Point counting. In Procedures in sedimentary petrology, ed. R. E. Carver, 385–407. New York, New York: Wiley-Interscience.
Garner, P. A., and J. H. Whitmore. 2011. What do we know about marine sand waves? A review of their occurrence, morphology and structure. Geological Society of America Abstracts with Programs 43, no. 5:596.
Gehrels, G. E., R. Blakey, K. E. Karlstrom, J. M. Timmons, B. Dickinson, and M. Pecha. 2011. Detrital zircon U-Pb geochronology of Paleozoic strata in the Grand Canyon, Arizona. Lithosphere 3, no. 3:183–200.
Goudie, A. S., A. Warren, D. K. C. Jones, and R. U. Cooke. 1987. The character and possible origins of the aeolian sediments of the Wahiba Sand Sea, Oman. Geographical Journal 153, no. 2:231–256.
Harrell, J. A., and K. A. Eriksson, 1979. Empirical conversion equations for thin-section and sieve derived size distribution parameters. Journal of Sedimentary Petrology 49, no. 1:273–280.
Heller, P. L., P. D. Komar, and D. R. Pevear. 1980. Transport processes in ooid genesis. Journal of Sedimentary Petrology 50, no. 3:943–952.
Jerolmack, D. J., and T. A. Brzinski III. 2010. Equivalence of abrupt grain-size transitions in alluvial rivers and eolian sand seas: a hypothesis. Geology 38, no. 8:719–722.
Johnson, M. R. 1994. Thin section grain size analysis revisited. Sedimentology 41, no. 5:985–999.
Khalaf, F. I., and I. M. Gharib. 1985. Roundness parameters of quartz sand grains of recent aeolian sand deposits in Kuwait. Sedimentary Geology 45, nos. 1–2:147–158.
Krinsley, D. H., and J. Doornkamp. 1973. Atlas of quartz sand grain textures. Cambridge, United Kingdom: Cambridge University Press.
Krinsley, D. H., and I. J. Smalley. 1972. Sand: The study of quartz sand in sediments provides much information about ancient geological environments. American Scientist 60, no. 3:286–291.
Krumbein, W. C. 1935. Thin-section mechanical analysis of indurated sediments. Journal of Geology 43, no. 5:482–496.
Kuenen, P. H. and W. G. Perdok. 1962. Experimental abrasion 5. Frosting and defrosting of quartz grains. Journal of Geology 70, no. 6:648–658.
Lancaster, N. 1995. Geomorphology of desert dunes. New York, New York: Routledge.
Lippman, F. 1973. Sedimentary carbonate minerals. New York, New York: Springer-Verlag.
Lockley, M. G. 1992. Fossil vertebrate footprints in the Coconino Sandstone (Permian) of northern Arizona: evidence for underwater origin: comment. Geology 20, no. 7:666–667.
Lundy, W. L. 1973. The stratigraphy and evolution of the Coconino Sandstone of northern Arizona. MS Thesis. Tulsa, Oklahoma:University of Tulsa.
Machel, H. G. 2004. Concepts and models of dolomitization: a critical reappraisal. Geological Society, London, Special Publications 235:7–63.
Mankiewicz, D., and J. R. Steidtmann. 1979. Depositional environments and diagenesis of the Tensleep Sandstone, eastern Big Horn Basin, Wyoming. In Aspects of diagenesis, ed. P. A. Scholle and P. R. Schluger, pp. 319-336. Tulsa, Oklahoma: SEPM Special Publication 26.
Margolis, S. V., and D. H. Krinsley. 1971. Submicroscopic frosting on eolian and subaqueous quartz sand grains. Geological Society of America Bulletin 82, no. 12:3395–3406.
Marzolf, J. E. 1976. Sand-grain frosting and quartz overgrowth examined by scanning electron microscopy; the Navajo Sandstone (Jurassic (?)), Utah. Journal of Sedimentary Petrology 46, no. 4:906–912.
Mazzullo, J. M., and R. Ehrlich. 1980. A vertical pattern of variation in the St. Peter Sandstone; Fourier grain shape analysis. Journal of Sedimentary Petrology 50, no. 1:63–70.
Mazzullo, J. M., and R. Ehrlich. 1983. Grain-shape variation in the St. Peter Sandstone: a record of eolian and fluvial sedimentation of an early Paleozoic sheet sand. Journal of Sedimentary Petrology 53, no. 1:105–119.
McKee, E. D. 1934. The Coconino Sandstone—its history and origin. In Papers concerning the palaeontology of California, Arizona, and Idaho 440:77–115. Washington D.C.: Carnegie Institution.
McKee, E. D. 1979. Ancient sandstones considered to be eolian. In A study of global sand seas, ed. E. D. McKee, 187–238. US Geological Survey Professional Paper 1052.
McMaster, K., J. H. Whitmore, and R. Strom. 2010. A comparison of beach and dune sands along the southern Oregon coast, USA. Geological Society of America Abstracts with Programs 42, no. 5:311.
Middleton, L. T., D. K. Elliott, and M. Morales. 2003. Coconino Sandstone. In Grand Canyon geology. 2nd ed., ed. S. S. Beus and M. Morales, 163–179. New York, New York: Oxford University Press.
Moorhouse, W. W. 1959. The study of rocks in thin section. New York, New York: Harper & Row.
Morrow, D. W. 1988. Dolomite—Part 1: the chemistry of dolomitization and dolomite precipitation. Geoscience Canada 9, no. 1:113–123.
Packham, G. H. 1955. Volume-, weight-, and number-frequency analysis of sediments from thin-section data. Journal of Geology 63, no. 1:50–58.
Peirce, H. W., N. J. Jones, and R. Rogers. 1977. A survey of uranium favorability of Paleozoic rocks in the Mogollon Rim and Slope Region—East Central Arizona. Tucson, Arizona: State of Arizona Bureau of Geology and Mineral Technology, circular 19.
Pettijohn, F. J., P. E. Potter, and R. Siever. 1973. Sand and Sandstone. New York, New York: Springer-Verlag.
Powers, M. C. 1953. A new roundness scale for sedimentary particles. Journal of Sedimentary Petrology 23, no. 2: 117–119.
Pye, K., and H. Tsoar. 2009. Aeolian sand and sand dunes. Berlin, Germany: Springer-Verlag.
R Development Core Team. 2011. R: A language and environment for statistical computing, R Foundation for Statistical Computing. Vienna, Austria. http://www.R-project.org/.
Ranney, W. D. R. 2001. Sedona through time. 2nd ed. Flagstaff, Arizona: Zia Interpretive Services.
Rascoe, B. Jr., and D. L. Baars. 1972. Permian system. In Geologic atlas of the Rocky Mountain region, ed. W. W. Mallory, 143–165. Denver, Colorado: Rocky Mountain Association of Geologists.
Rawson, R. R., and C. E. Turner-Peterson. 1980. Paleogeography of northern Arizona during the deposition of the Permian Toroweap Formation. In Paleozoic paleogeography of the west-cental United States, ed. T. D. Fousch and E. R. Magathan, 341–352. Society of Economic Paleontologists and Mineralogists, Rocky Mountain Section.
Reiche, P. 1938. An analysis of cross-lamination: the Coconino sandstone. Journal of Geology 46, no. 7:905–932.
Ross, C. A., and W. W. Tyrrell Jr. 1965. Pennsylvanian and Permian fusulinids from the Whetstone Mountains, southeast Arizona. Journal of Paleontology 39, no. 4: 615–635.
Sahu, B. K. 1966. Thin-section analysis of sandstones on weight-frequency basis. Sedimentology 7, no. 3:255–259.
Sahu, B. K. 1976. Mathematical theory of counting two-dimensional grains by line and ribbon methods. Sedimentary Geology 16, no. 3:177–192.
Scholle, P. A., and D. S. Ulmer-Scholle. 2003. A color guide to the petrography of carbonate rocks: Grains, textures, porosity, diagenesis. Tulsa, Oklahoma: American Association of Petroleum Geologists Memoir 77.
Selley, R. C. 1985. Ancient sedimentary environments. 3rd ed. London, United Kingdom: Chapman and Hall.
Shepard, F. P., and R. Young. 1961. Distinguishing between beach and dune sands. Journal of Sedimentary Petrology 31, no. 2:196–214.
Sibley, D. F., and J. M. Gregg. 1987. Classification of dolomite rock textures. Journal of Sedimentary Research 57, no. 6:967–975.
Simone, L. 1981. Ooids: a review. Earth-Science Reviews 16:319–355.
Smalley, I. J., and C. Vita-Finzi. 1968. The formation of fine particles in sandy deserts and the nature of ‘desert’ loess. Journal of Sedimentary Petrology 38, no. 3:766–774.
Sorauf, J. E. 1962. Structural geology and stratigraphy of the Whitmore area, Mohave County, Arizona. PhD Thesis. Lawrence, Kansas: University of Kansas.
Strahler, A. N. 1999. Science and earth history—The evolution/ creation controversy. Amherst, New York: Prometheus Books.
Swezey, C. 1998. The identification of eolian sands and sandstones. Geomaterials (Géomatériaux) (Comptes Rendus de l’Academie des Sciences—Series 11A—Earth and Planetary Science) 327, no. 8:513–518.
Thiel, G. A. 1940. The relative resistance to abrasion of mineral grains of sand size. Journal of Sedimentary Petrology 10, no. 3:103–124.
Tucker, M. E. 1981. Sedimentary petrology: An introduction. Oxford, United Kingdom: Blackwell Scientific Publications.
Turner, C. E. 2003. Toroweap Formation. In Grand Canyon geology, 2nd ed., ed. S. S. Beus and M. Morales, 180–195. New York, New York: Oxford University Press.
Van der Plas, L. 1962. Preliminary note on the granulometric analysis of sedimentary rocks. Sedimentology 1, no. 2: 145–157.
Walker, T. R. 1957. Frosting of quartz grains by carbonate replacement. Geological Society of America Bulletin 68, no. 2:267–268.
Weber, C. G. 1980. The fatal flaws of Flood geology. Creation/ Evolution 1, no. 1:24–37.
Whitmore, J. H., and R. Strom. 2010. Sand injectites at the base of the Coconino Sandstone, Grand Canyon, Arizona. Sedimentary Geology 230, nos. 1–2:46–59.
Whitmore, J. H., G. Forsythe, and P. A. Garner. 2012. Significance of parabolic recumbent folds in Permian rocks, Sedona, Arizona. Geological Society of America Abstracts with Programs 44, no. 7:556.
Whitmore, J. H., G. Forsythe, and P. A. Garner. 2015. Intraformational parabolic recumbent folds in the Coconino Sandstone (Permian) and two other formations in Sedona, Arizona (USA). Answers Research Journal 8 (in press).
Wright, J. 2001. Making loess-sized quartz silt: data from laboratory simulations and implications for sediment transport pathways and the formation of ‘desert’ loess deposits associated with the Sahara. Quaternary International 76/77:7–19.
Young, D. A., and R. F. Stearley. 2008. The Bible, Rocks and Time. Downers Grove, Illinois: InterVarsity Press.