
Finding Adam in the Genome: Does BioLogos Have Even More Egg on Its Face?
Our last post promised to document and detail a strong accusation: that BioLogos has engaged in systematic scientific error on one of their most prominent “evidences” for evolution, and that they have misrepresented the arguments for and against their claims for several years. Today’s post delivers on this promise—covering the first several years of the controversy.
The Conception of an Idea
In March of 2008, a group of evolutionists published a paper1 on which Venema bases all of his claims about the supposed existence of an egg-laying “pseudogene” in humans. In other words, if we think of genes as words, Venema claims that humans have a misspelled version of a DNA word involved in the formation of egg yolks. Since chickens lay eggs but humans do not, Venema sees this fact as evidence of human-bird common ancestry.
However, the goals of the 2008 study were less audacious. The authors already assumed that evolution was true, and they simply sought to put more flesh on the skeleton of mammal evolution. Specifically, using genetics as a tool, the authors wanted to pin down the details of how placental mammals evolved from egg-laying ancestors.
The authors specifically claimed to have found three vitellogenin remnants in humans.
In this paper, the authors used the spatial positioning of various genes in chickens and other species to identify a likely genetic spot in which to look for vitellogenin remnants. By analogy to language, it’s like trying to spot an evolutionary relationship between words by examining the paragraphs and sentences—the grammatical contexts—in which these words normally occur. Using this approach, the authors specifically claimed to have found three vitellogenin remnants in humans.
However, rather than publish the actual percent identity between the chicken vitellogenin sequence and the purported human vitellogenin sequence, the authors reported their results in graphical form. By putting the linear sequence of chicken DNA on the x-axis (at a very zoomed-out level—the actual DNA letters are not visible) and the linear sequence of human DNA on the y-axis, the authors showed where human and chicken DNA matched. To make matches between chicken genes and human genes easier to find, they drew vertical and horizontal lines from each DNA sequence. All genes (chicken and human) were drawn with green lines, except for one—the vitellogenin gene, which was highlighted in yellow. In fact, chickens have three versions of the vitellogenin gene—shown as vit1, vit2, and vit3 in Figures 1–2.
Where human and chicken DNA matched, small black flecks were drawn. I’ve highlighted the most relevant sections of these comparisons with gray boxes.
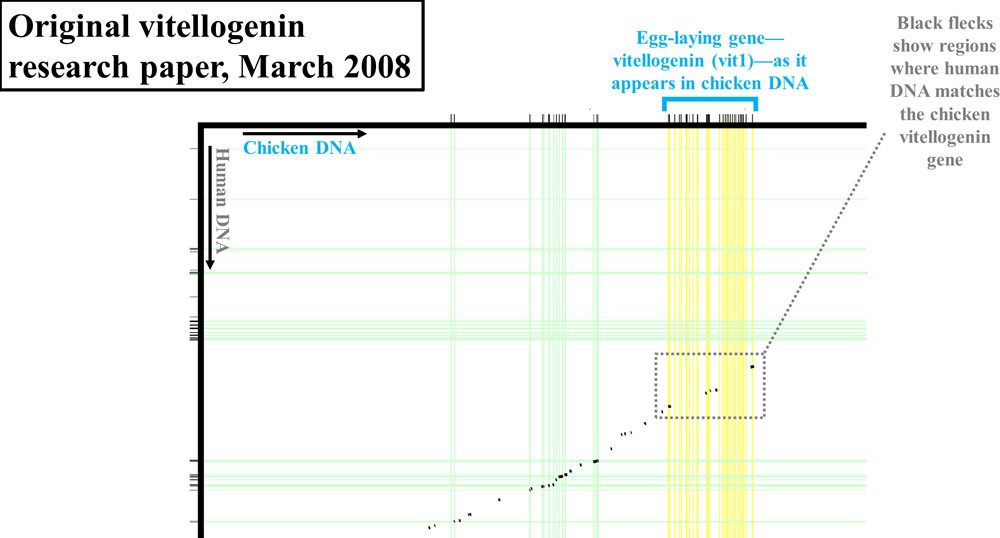
Figure 1. Vitellogenin (vit1) display from 2008 paper. Adapted from PLoS Biol.2
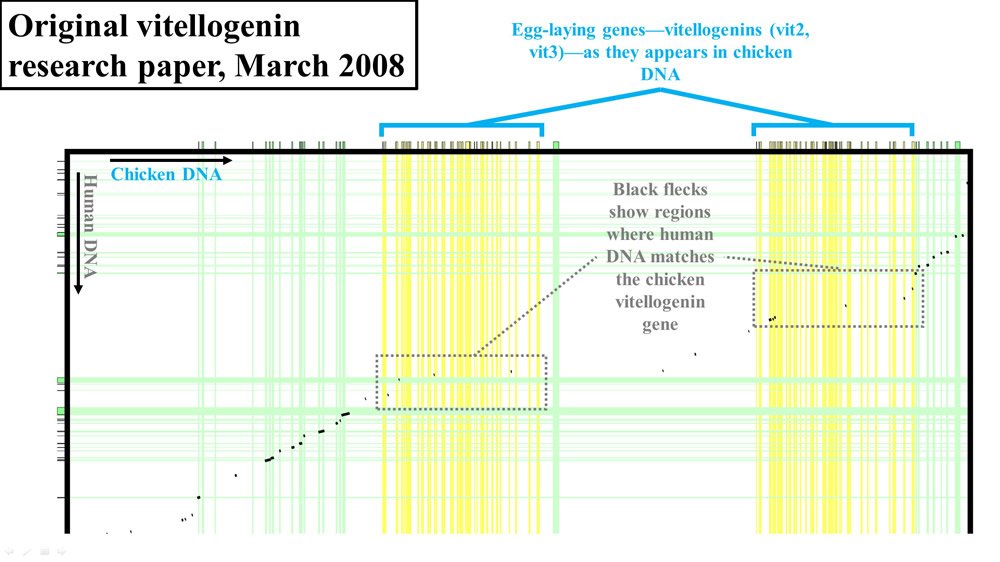
Figure 2. Vitellogenin (vit2 and vit3) display from 2008 paper. Adapted from PLoS Biol.3
If the chicken and human DNA were nearly identical, you wouldn’t see black flecks in these gray boxes. Instead, you would see a nearly continuous black line, indicating high levels of identity between the DNA of these two species. In fact, as should be apparent in these diagrams, the level of identity between the two species in this region of DNA was very low.
Exactly how low, the authors never said.
Furthermore, if we draw these diagrams to scale (based on length of the DNA sequence covered), it should be apparent from these displays that the vit1 (shown as VIT1 in Figure 3) gene was bigger than either vit2 (shown as VIT2) or vit3 (shown as VIT3) (see Figure 3).
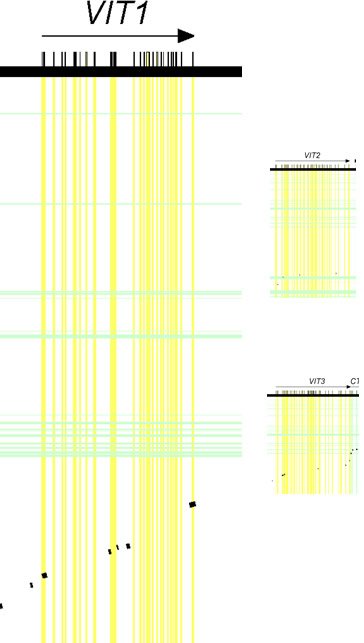
Figure 3. Relative sizes of vitellogenin genes. Drawn to scale. Adapted from PLoS Biol.4
Together, these results suggested that the vit1 gene held the most potential for supporting the authors’ claims of human-chicken common ancestry.
The Birth of a Challenge
By May of 2010, Venema was promoting these vitellogenin results as evidence of evolution. He boldly laid down the gauntlet for all those opposed to evolution:
The mere presence of the mutated remains of a gene required for making egg yolk in the human genome should give even the most ardent anti-evolutionist pause. That this gene was found using the prediction of shared synteny [spatial positioning of genes] between humans and chicken only adds to the impact.5
Venema then took his challenge one step further, impugning the character of those who disagreed.
Time and again, what we see from Christian anti-evolutionary organizations is not an attempt to wrestle with the data, but rather to obfuscate it.6
However, Venema never published his own analysis of the 2008 paper. He didn’t attempt to identify the actual percent identity between the chicken vitellogenin sequence and the purported human vitellogenin sequence. Instead, he simply cited the paper and took the results at face value.
Flaunting Pictures of the Baby
By February of 2012, it was apparent that Venema saw this evidence as especially damaging to creationist views. Instead of just citing the 2008 paper, Venema put the data on full display.7 However, rather than fill in the void left by the 2008 paper and do his own analysis in order to come up with an exact number, Venema created his own visual display of the 2008 data.
This is where his problems multiplied. Look carefully at Figure 4. I’ve redrawn the 2008 graph, and overlaid it (to scale) with Venema’s display. In Figure 4, the horizontal width of either the black flecks (from the 2008 paper) or the cluster of four boxes on the Homo sapiens (human) line (from Venema’s article) represents the amount of chicken DNA sequence that matches human DNA. As you can see, Venema grossly exaggerated the data displayed in the 2008 paper. His boxes are far wider than the black flecks, making the identity between chicken DNA and human DNA appear much higher than it actually is.
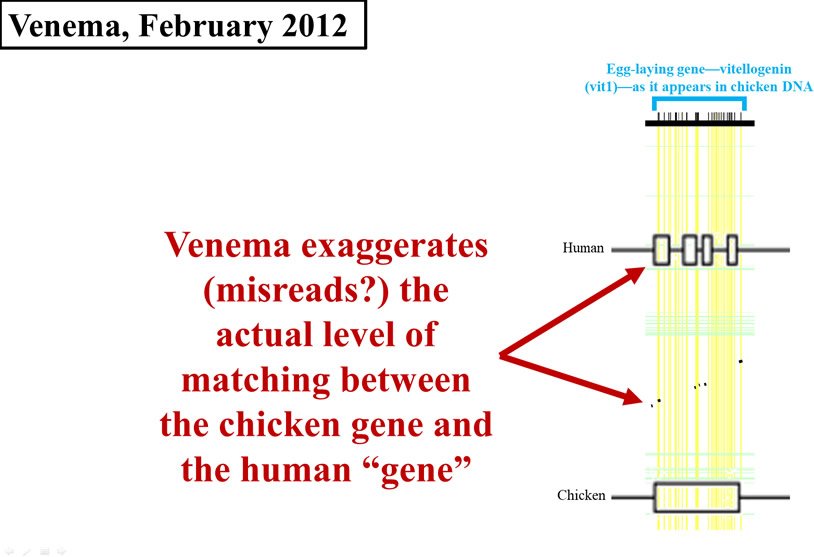
Figure 4. Comparison of early 2012 Venema diagram to 2008 paper. Adapted from PLoS Biol.,8 and from BioLogos.9
In September of the same year,10 Venema apparently felt strongly enough about the vitellogenin data that he decided to take specific creationist organizations to task. He went so far as to create a table of anti-evolutionary organizations, complete with their response (or lack thereof) to the vitellogenin claims.
Nevertheless, Venema once again failed to supply an actual number for the identity between human and chicken vitellogenin sequences. Instead, he published an alignment of a tiny section of the vitellogenin region from multiple species, and he also republished what appears to be the same exaggerated chart (Figure 5):
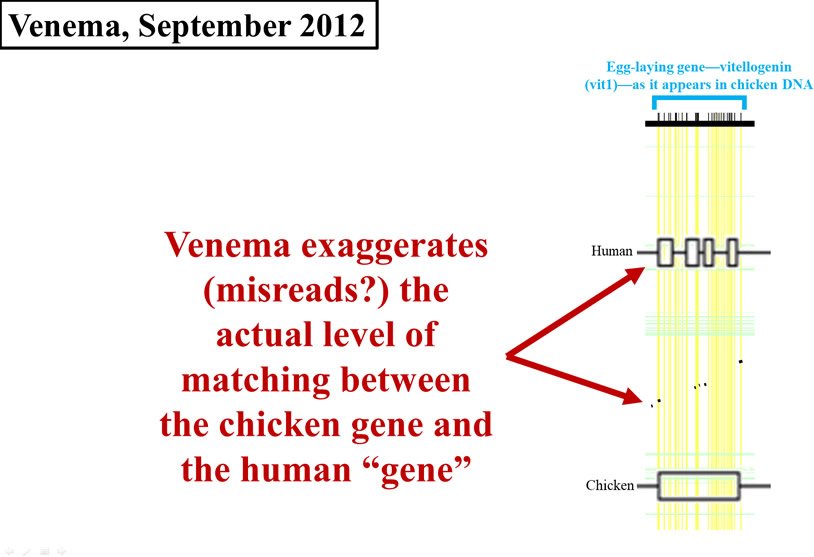
If the February gauntlet weren’t enough, Venema upped the ante once again:
I would invite these [creationist] groups, all of whom . . . suggest that “junk DNA” is no longer a tenable idea, to “take the test” and offer an explanation for the features we observe in the human Vitellogenin 1 pseudogene.13
Egg in the Face?
In October of 2015, the YEC geneticist Jeff Tomkins of the Institute for Creation Research accepted Venema’s invitation. Tomkins began by doing what no one had done thus far—reanalyze the raw data and publish an actual number for the percent identity between the two sequences. Across the vit1 gene region in chickens and humans, Tomkins found only 39% identity.
This number is even lower than it appears. Because the chemical alphabet of DNA contains only four letters, the chance of random matches is high. Statistically, in an alignment of two random DNA sequences, about 25% of them will be identical. Thus, when we score DNA alignments, we’re not really analyzing the results on a scale of 1 to 100. Rather, we’re analyzing them on a scale of 25 to 100—a scale of only 75 points.
If we were to convert Tomkins’ results to a 100-point scale, his reported identity drops. On a 75-point scale (i.e., on the 100-point scale that we just used, but which is actually not 100 points because “zero” is not 0% but 25%), the reported 39% identity represents 61 points of difference (100 – 39 = 61) and only 14 points of identity (39 – 25 = 14). If we divide the latter number into 75, we discover that the identity is only about 20% (14 / 75 = 19%, which can be rounded to 20%).
Let’s use Venema’s language analogy to understand the significance of these numbers. For example, we could find words that match in only 20% of their letters. As an illustration, the word zebra is a five-letter word; since only 1 of its 5 letters matches the word quota,14 these two words are 20% identical.
Is zebra a broken, nonfunctional relic of the word quota?
Venema gives great significance to the way in which the purported human vit1 “remnant” was discovered.
We can take this analogy a step further. In the genetic realm, Venema gives great significance to the way in which the purported human vit1 “remnant” was discovered. He thinks that the shared spatial positioning of genes around the vitellogenin region is added evidence in support of the hypothesis that humans possess a broken vitellogenin gene. By analogy to language, we could easily imagine two sentences in which our two words were surrounded by similar words—words would occupy a similar spatial position in the sentence.
For example, let’s use zebra in the following sentence: “The native habitat of the zebra is Africa.” Now let’s use its evolutionary relative, quota, in a sentence: “The hunting of native animals by foreigners has reached its quota in Africa.” I’ve highlighted in bold the shared words which have the same spatial relationship to the two words in question—the words the and native both appear in these sentences before zebra or quota, and the word Africa appears in these sentences after zebra and quota. By Venema’s logic, these sentences strengthen the evolutionary relationship between zebra and quota.
Obviously, this claim for an evolutionary relationship between zebra and quota is nonsensical. How much more so in the vitellogenin example that Venema cites.
In our next article, we’ll observe how Venema’s response to Tomkins creates even more problems for Venema’s position.
Footnotes
- D. Brawand, W. Wahli, and H. Kaessmann, “Loss of Egg Yolk Genes in Mammals and the Origin of Lactation and Placentation,” PLoS Biol. 6, no. 3 (2008): e63, 10.1371/journal.pbio.0060063.
- Ibid.
- Ibid.
- Ibid.
- Dennis Venema, “Signature in the Pseudogenes, Part 2,” BioLogos, May 17, 2010, http://biologos.org/blogs/dennis-venema-letters-to-the-duchess/signature-in-the-pseudogenes-part-2.
- Ibid.
- Dennis Venema, “Is there ‘Junk’ in Your Genome? Part 4,” BioLogos, February 17, 2012, http://biologos.org/blogs/dennis-venema-letters-to-the-duchess/understanding-evolution-is-there-junk-in-your-genome-part-4.
- Brawand et al., “Loss of Egg Yolk Genes.”
- Venema, “Is there ‘Junk’ in Your Genome? Part 4.”
- Dennis Venema, “Encode and ‘Junk DNA,’ Part 2: Function: What’s in a Word?,” BioLogos, September 26, 2012, http://biologos.org/blogs/dennis-venema-letters-to-the-duchess/encode-and-junk-dna-part-2.
- Brawand et al., “Loss of Egg Yolk Genes.”
- Venema, “Encode and ‘Junk DNA,’ Part 2.
- Ibid.
- Technically, since the English language has only 26 letters, random matches occur about 4% of the time. Thus, a 1-in-5 match represents a 20% identity on a 96-point scale. If we were to convert this to a 100-point scale, the identity would be even lower.
Support the creation/gospel message by donating or getting involved!

Answers in Genesis is an apologetics ministry, dedicated to helping Christians defend their faith and proclaim the good news of Jesus Christ.
- Customer Service 800.778.3390
- © 2024 Answers in Genesis