
Rapid Changes in Oxygen Isotope Content of Ice Cores
Caused by Fractionation and Trajectory Dispersion Near the Edge of an Ice Shelf
Originally published in Journal of Creation 11, no 1 (April 1997): 52-60.
Abstract
Oxygen isotopes in ice cores extracted from polar regions exhibit a decreasing trend in the ratio of the heavy to light isotopes from the beginning of the Ice Age to its end.
Summary
Oxygen isotopes in ice cores extracted from polar regions exhibit a decreasing trend in the ratio of the heavy to light isotopes from the beginning of the Ice Age to its end, at which point the trend reverses sharply and then remains fairly constant for several thousand years. This trend has been interpreted by the conventional climate community to have occurred over about 100,000 years and is due primarily to changes in oceanic and atmospheric temperatures as the lighter isotope of oxygen is preferentially transferred slowly from the oceans to ice during glaciation and the rapid transfer back to the ocean during deglaciation. This paper will explore an alternative explanation for this trend. The growth of ice shelves during the Ice Age is shown to cause a decreased isotopic ratio at long distances from the edge of an ice shelf because of the fractionation of isotopes as a function of the vertical temperature distribution in the atmosphere and the dispersion of snow by crystal type, fall velocity, and wind fields. If ice shelves grew slowly during the Ice Age and melted rapidly during deglaciation, the trend observed in ice cores can be explained in thousands of years, consistent with a short interpretation of earth history.
Introduction
Since the 1960s several long ice cores have been extracted from the polar ice caps, including those from Camp Century, Dye-3, Crete, Milcent and Summit in Greenland, and from Byrd, Vostok and Dome C in Antarctica. Numerous quantities have been measured in ice cores to make inferences about earth history, such as oxygen isotope ratios, carbon dioxide concentration, methane concentration, electrical conductivity, and dust particle concentration. Probably the most important measurement used in the study of climate has been the ratio of oxygen 18 to oxygen 16 (18O/16O). This measurement is converted into a variable called δ18O, a measure of the difference in oxygen isotope ratio between a sample of ice and sea water.1 It is thought to be useful as a palaeothermometer—a method for estimating the temperature of the ocean or the atmosphere in the past. The trends in past climate inferred from measurements in ice cores and sea-floor sediment have led to the conclusion in conventional literature that numerous ice ages lasting about 100,000 years separated by 'interglacials' lasting 10,000 years or so have occurred on the earth. This paper will address an alternative explanation for the trends in δ18O from a young-earth perspective.
Ice cores and sea floors
Clausen and Langway,2 Dansgaard et al.,3–6 Garfield and Ueda,7 Hammer,8 Hammer et al.,9–11 Johnsen,12 Johnsen et al.,13,14 Langway,15 and Ueda and Garfield16 have described the collection, analysis, and interpretation of long ice cores from Greenland. Garfield,17 Gow,18 Johnsen et al.,19 Lorius et al.,20,21 Merlivat and Jouzel,22 Petit et al.,23–25 Ueda and Garfield,26 and Ueda and Hansen27 have reported on cores from Antarctica. The major conclusions from these studies are that the most recent ice age lasted about 100,000 years and consisted of gradual cooling and glaciation followed by rapid deglaciation. It was preceded and followed by warm interglacials which lasted on the order of about 10,000 years. The glacial period shows significant shorter-period oscillations in climate. Cores from both Greenland and Antarctica show similar trends in magnitude and timing, implying that whatever the cause of the ice age it appears to be global and synchronous. Vardiman28 has summarized the climate research on ice cores, and has offered an alternative analytical model of ice sheet formation in the polar regions and a conceptual model for rapid climate change during an ice age related to the Genesis Flood.
Variations in oxygen isotope ratios from sea-floor sediment cores have extended climate studies to greater ages in the past, and have been interpreted to support multiple ice ages with intervening interglacials over at least the past one million years. Kennett et al.,29 Savin et al.,30 and Shackleton et al.31 have described the collection analysis, and interpretation of sea-floor sediments in terms of ice ages. Vardiman32 has summarized the research on sea-floor sediment cores and developed an analytical model of rapid sediment accumulation following the Genesis Flood.
Correlation of palaeotemperatures derived from sea floor sediments with variations in solar heating of the earth caused by periodic changes in the orbital parameters of the earth-sun system has led to a widely-accepted explanation for ice ages called the Astronomical Theory. This theory was originally suggested by Milankovitch,33 but has recently gained popularity in such reports as CLIMAP,34,35 and Hays et al.36
Several major problems have not been resolved in this theory. First, of the three orbital parameters correlated in these studies the one with a period of about 100,000 years, which should be the cause of the ice ages, has the smallest effect on solar heating of the earth. It is so small that the ice ages cannot be explained by its direct effects alone. This is the reason Hays et al.37 entitled their paper 'Variations in the Earth's orbit: Pacemaker of the Ice Ages'. A secondary feedback mechanism in the ocean-atmosphere system has been suggested to be necessary.
Second, if such a secondary mechanism exists, it is not understood nor has it been quantified. This feedback mechanism, thought to be triggered by orbital variations, is a primary basis for current environmental extremism. It is believed that a minor perturbation in solar heating caused by orbital changes could lead to another ice age or warming period. If this is so, what would measurable changes in greenhouse gases like carbon dioxide and ozone produce on climate? Our current state of knowledge about climate change mechanisms is so poor that it does not justify extreme environmental policy changes being implemented today nor support the Astronomical Theory.
Third, the orbital parameters should tend to produce greater cooling or heating in the northern hemisphere than the southern hemisphere at different periods. This should lead to non-synchronous peaks in ice coverage in the two hemispheres. Yet the ice age appears to be synchronous.
Fourth, changes in ice cover were recently found to have occurred at extremely high rates near the Younger Dryas Event. The Younger Dryas Event is a climate reversal preceded and followed by abrupt warming during the deglaciation period about 11,000 years BP, according to the conventional chronology. The event is documented in the δ18O of most ice cores and many sea-floor sediment cores. Alley et al.38, 39 have reported that portions of the Younger Dryas Event appear to have occurred in periods of less than four years. If these processes occurred in such short periods, the entire chronology of the ice age is brought into question. For example, the average global ocean temperature is typically estimated by the oxygen isotope ratios measured in ice cores. If these palaeotemperatures changed abruptly, by 5°C or so, they probably don't represent average temperature, because the average ocean temperature could not change this much without a catastrophic cause. An underlying assumption of the Astronomical Theory is uniformitarianism.
It is likely that for these reasons and others the Astronomical Theory is not a correct explanation for climate change on the earth and therefore oxygen isotope trends in ice and sea-floor sediment cores. Vardiman40 suggested that major trends in oxygen isotope ratios in ice cores could be explained by the formation and decay of ice shelves on the polar oceans. This paper will attempt to develop a simple model of precipitation formation in polar regions to validate this conceptual model. The distribution of oxygen isotope ratios in snow will be computed relative to the edge of an ice shelf under typical environmental conditions and interpreted in terms of observations made in recent ice cores.
Ice core data
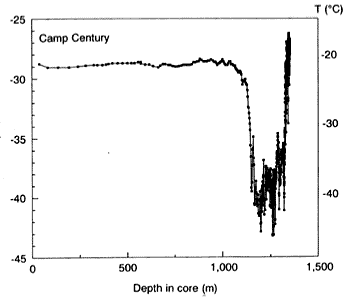
Figure 1. δ18O vs. depth in the core from Camp Century, Greenland.
Figures 1, 2 and 3 show δ18O as a function of depth for Camp Century, Dye–3 and Summit in Greenland. Uniform values of δ18O have been consistently observed in the upper portion of ice cores, with a minimum in the lower portion and a maximum at the very bottom. By assuming that the fractionation of the two isotopes of oxygen is proportional to the temperature at which precipitation is formed in the atmosphere, an historical trend in temperature near the earth's surface can be calculated. The estimated air temperatures are shown on the right sides of Figures 1, 2 and 3. The temperatures are calculated from the values of δ18O using Equation 7, to be discussed later. The high values of δ18O and therefore, high air temperatures at the very bottom of the cores, are thought to support the idea of a warm ocean prior to the last ice age. The slow cooling of the oceans over about 100,000 years resulted in a glacial maximum near the minimum in δ18O. An, as yet, unexplained change in climate caused the rapid deglaciation and warming near the steep increase in δ18O, just to the right of the homogeneous upper portion of the cores. Because the lower portions of the ice sheets are compressed strongly by the weight of the ice above, the conventional interpretation of these data attributes long periods of time to the lower parts of the cores. Vardiman41 has reinterpreted the time model suggesting that high precipitation rates likely occurred following the Genesis Flood shortening this time period greatly.
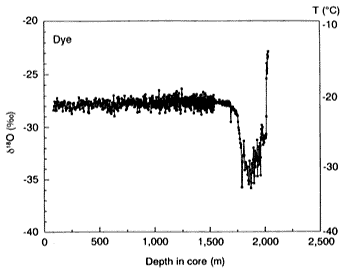
Figure 2. δ18O vs. depth in the core from Dye–3, Greenland.
Because only minor changes in solar heating have been assumed in the past, the large cooling and heating in the ocean temperature inferred from Figures 1, 2 and 3 are thought to require long periods of time. A decrease in ocean temperature produces a change in fractionation of the two isotopes of oxygen, resulting in lower values of δ18O. The heavier isotope of oxygen, 18O, is slower to evaporate into the atmosphere, leaving the ocean enriched in 18O and the atmosphere depleted. When the atmospheric water vapour is subsequently precipitated as snow it exhibits low values of δ18O. In addition to this temperature effect, Bowen42 and Petit et al.43 have suggested that variations in the δ18O of snow in polar regions may also be due to variations in δ18O at the source, the distance from the evaporation source to the deposition site, and the type of precipitation process which converts water vapour to snow in the atmosphere. Changes in the temperature of the condensation level, and altitude effects due to topography, can also affect δ18O. Although all of these processes are probably active in producing the trends observed in the ice cores, this paper will address the effect of distance from the evaporation source on trends in δ18O at the accumulation site.
The formation of ice shelves
The oceans are the primary source of water vapour for transport to the polar regions and precipitation as snow. The rate of evaporation from the open ocean is a function of the air-sea-surface temperature difference, atmospheric stability, and wind speed. The vapour pressure above a water surface is an exponential function of temperature, and the evaporation rate is closely related. The evaporation rate has been suggested by some to be proportional to the square of the wind speed across the ocean surface. The total function is often modeled as a product of these two relationships.
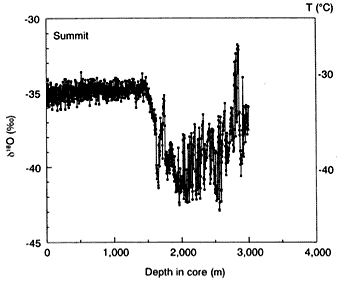
Figure 3. δ18O vs. depth in the core for Summit, Greenland.
Following the Genesis Flood, as the oceans cooled and heavy snowfall occurred in the polar regions, it is likely that ice shelves began to develop slowly outward from the continents and equatorward from the poles. The greatest rate of ice shelf development probably occurred near the end of the Ice Age. Formation of such ice shelves would cause a discontinuous decrease in evaporation of water vapour from the underlying ocean surfaces into the atmosphere. As these shelves grew equatorward the primary source of water vapour for snow formation was moved farther away from continental ice sheets where ice cores were later drilled. It is anticipated that the heaviest snowfall would typically occur near the edges of the ice shelves because of higher water vapour contents and dynamic effects. This greater mass of snow would fall from the lower portions of the clouds where warmer temperatures prevail. The number of ice crystals nucleated in a cloud is proportional to a negative exponential function of temperature. The higher and colder in a cloud, the greater the concentration but the smaller the size of the crystals formed. Small ice crystals fall more slowly than larger or more heavily rimed ones. Ice crystals become 'rimed' when they fall through super-cooled liquid cloud droplets. They collect the cloud droplets by collision and adhesion. The snowfall would be less intense and form higher and colder in the clouds farther away from the edges of the ice shelves. Because winds are typically stronger at higher altitudes, snow formed high in the clouds would also be transported longer distances before falling to the ground. Stronger updrafts near the edges of the ice shelves would also suspend smaller, slower-falling ice crystals.
If the fractionation of oxygen isotopes during the phase change from vapour to ice is proportional to temperature, as it is from liquid to vapour, δ18O would be more negative the colder the temperature and the higher in the cloud the snow is formed. Therefore, the farther the edges of the ice shelves are from the accumulation sites, the more negative δ18O would be. If δ18O is interpreted to only be a result of the ocean temperature, it would then appear that the ocean has cooled dramatically to produce this effect. However, this trend could be a result of the greater distance from the source of evaporation beyond the edge of an ice shelf to the accumulation site as the ice shelves grew slowly equatorward. The gradual decrease in δ18O from the bottom of the ice cores to the minimum in δ18O shown in Figures 1, 2 and 3 could be partially explained by an increasing distance from the source region to the accumulation site as the ice shelves grow.
The sudden rebound in δ18O to higher values above the minimum in δ18O has been typically explained by the 'deglaciation' brought about by some as yet unknown mechanism which produced sudden warming. However, recent evidence has shown that this 'deglaciation' occurred in an extremely short period of time. Some events in this steep portion of the curve, such as the 'Younger Dryas', show periods as short as four years.44,45 If δ18O is primarily a function of ocean temperature, then this rebound implies that the ocean surfaces warmed by as much as 20°C in a period of a few hundred years or less. No one has suggested a mechanism for such dramatic warming of all the oceans.
The alternative to this scenario is the realization that the variation of δ18O in Figures 1, 2 and 3 may be primarily due to the effect of ice shelves growing slowly equatorward and then suddenly melting, changing the distance between the evaporation source and the accumulation site. If most of the trend in δ18O is assumed to be due to this effect, Figures 1, 2 and 3 can be used to estimate the average sea-surface temperature at the end of the Genesis Flood. The average global ocean temperature today is about 3.5°C, and the average global sea-surface temperature is about 18°C. If the amount of permanent ice cover on the oceans today is similar to that at the end of the Genesis Flood (not really true), and the isotopic fractionation is proportional to the average sea-surface temperature, then the difference in δ18O between the very oldest ice at the bottom of the ice cores and the homogeneous conditions of today should represent the temperature change between then and now. The difference appears to be about 40℃ or about 6°C. This means the average sea-surface temperature at the end of the Genesis Flood may have been about 24°C.
Precipitation trajectories
Although the conceptual model of precipitation formation and isotope fractionation presented above would seem to agree with the trends of δ18O observed in ice cores, the case has yet to be made for the strength of the effects being of the correct magnitude. The ultimate test of this model is the calculation of predicted changes in δ18O and agreement with the measured values. Lord Kelvin stated this principle eloquently:
'I often say that when you can measure what you are speaking about, and express it in numbers, you know something about it; but when you cannot express it in numbers, your knowledge is of a meagre and unsatisfactory kind; it may be the beginning of knowledge, but you have scarcely, in your thoughts, advanced to the stage of science, whatever the matter may be.' 46
The complete quantification of this model must await the development of better numerical models which can fully treat the vertical and horizontal wind fields, the formation of condensate in a cloud, the nucleation and growth of ice crystals, the fractionation of oxygen isotopes as a function of height and temperature in the cloud, and the fallout and transport of ice crystals to the ground as a function of distance from the edge of the ice shelf. However, a few crude calculations using the basic equations which describe the processes above will be reported in this paper as a precursor to a more complete development to be attempted later.
The normal manner in which calculations would be made on precipitation formation and transport would be by the development of an Eulerian system of coordinates. In the Eulerian system, a set of boxes are defined through which the air and particles flow. A budget of water mass is maintained in each box and fluxes of condensate and precipitation particles through the top, bottom and sides are computed. The final distribution of precipitation is the flux through the bottom layer of boxes. A reasonable set of dimensions would be 1,000 km in the horizontal direction in 5 km increments and 10 km in the vertical in 250 m increments. This would result in 2,000 boxes each 0.25 km high by 10 km on each side. The vertical dimensions would allow a small ice crystal to fall from 5 km to the ground in about 10 hours, during which time it would travel about 700 km horizontally in a 20 metre/second wind and still be within the grid. On the other hand, a large, heavily-rimed ice crystal could fall from 1 km to the ground in about 30 minutes and travel about 10 km horizontally in a 5 metre/second wind so that fine features of the precipitation distribution could be distinguished.
In the calculations to follow, however, a Lagrangian system of coordinates will be used. This system follows a single precipitation particle from nucleation to fallout on the ground as snow. The simple calculations in this approach will not consider mass balance nor permit a calculation of precipitation rate to be computed at the ground, but will allow easy visualization of the trajectories of the particles. Twelve particles starting from different positions in a typical wind field will be followed to demonstrate how the starting point influences the final fallout position, mass, and δ18O. Figure 4 shows the initial positions of the 12 particles as black dots and the assumed wind field in a vertical cross-section above and perpendicular to the ice shelf as arrows. The 12 starting positions are upwind of the ice shelf and representative of typical nucleation locations for ice crystals.
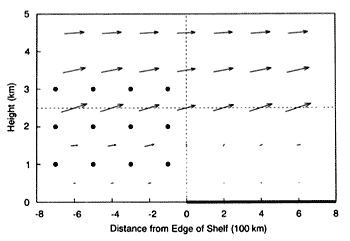
Figure 4. Initial position of 12 particles in a typical wind field.
For these calculations, the wind field was assumed to be constant in time. However, the vertical and horizontal components vary in space relative to the edge of the ice shelf as shown at the bottom of Figure 4. The horizontal wind components are composed of two factors, one of which is dependent on the quadrant in the diagram and the other dependent on altitude. In all four quadrants the magnitude of the first factor of the horizontal wind component varies linearly from 0 metres/second at the outer boundaries (±800 km horizontally and 0 and 5 km vertically) to 5 metres/second at the centre lines (0 km horizontally and 2.5 km vertically). The direction of the wind is to the right in the upper two quadrants and toward the edge of the ice shelf in the lower two quadrants (to the right in the lower left quadrant, and to the left in the lower right quadrant). This first factor in the horizontal wind is typical of the atmospheric flow relative to a surface thermal discontinuity, like what would be expected over warm water to the left of the edge of the ice shelf and ice to the right. Because of maximum upward motions near the edge of the ice shelf, air would normally converge at low levels and diverge aloft.
The second factor in the horizontal wind is the general increase in wind from the surface upward. In this model the horizontal wind toward the right is assumed to increase linearly from 0 metres/second at the surface to 20 metres/second at 5 km in altitude. When these two factors are multiplied together the horizontal wind is nearly zero in the lower right hand quadrant, as seen in Figure 4, and increases upward through both left-side quadrants. The upper right quadrant is almost uniform, with slightly stronger winds at 2.5 km.
The vertical wind field is similar to the first factor in the horizontal wind field, but the maximum upward velocity occurs at the edge of the ice shelf and at 2.5 km, and can be set to any desired value. This maximum value will be varied from 0.1 metres/second to 5 metres/second for this study. Synoptic-scale vertical motions are typically at the low end of this range. The value of the maximum vertical component of the wind field shown in Figure 4 is 5 metres/second. This general wind pattern is often observed near fronts in the atmosphere or surface thermal discontinuities. The wind field for this study was prescribed, but could be solved from the equations of motion using general boundary conditions.
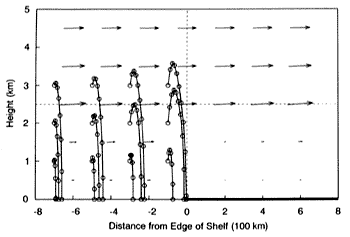
Figure 5. Trajectories of graupel in a 100 cm/sec maximum vertical wind.
Three types of ice crystals were assumed to be nucleated at each of the 12 starting positions. The position, mass and δ18O were calculated at 10 minute intervals as each crystal fell and drifted with the wind. The three types of crystals used were graupel, spatial dendrites, and planar crystals. Graupel are small hailstones that grow in strong convective updrafts with abundant super-cooled water droplets. They have relatively high terminal velocities. Spatial dendrites are three-dimensional crystals with intermediate terminal velocities. Planar crystals are two-dimensional plates and dendrites with low terminal velocities. The diameter of each crystal was assumed to grow at the rate of 1 micrometre/second. This growth rate was assumed to be independent of crystal type, temperature, vapour pressure and crystal concentration. This is a very crude assumption and must obviously be treated more completely in future modeling. However, the numerical value of 1 micrometre/second is a reasonable average value shown by Ryan et al.47 The terminal velocity of these three crystal types are given by Mason48 as:
Graupel: νt = 0.5D (1)
Spatials: νt = 0.55D (2)
Planars: νt = 0.3D (3)
where νt is the terminal velocity in metres/second and D is the diameter of the crystal in millimetres.
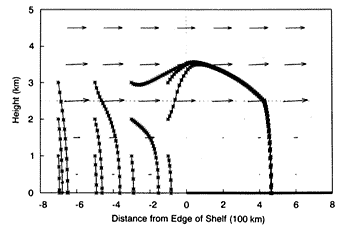
Figure 6. Trajectories of spatial crystals in a 100 cm/sec maximum vertical wind.
The crystals were allowed to fall relative to the ground at a speed equal to the difference between the vertical component of the assumed wind at their location and their terminal velocities. They were allowed to drift horizontally with the horizontal component of the assumed wind. For stronger updrafts and slower falling crystals, the trajectories of the crystals were upward to the right, often drifting for long distances before reaching the ground. For weaker updrafts and faster falling crystals, the trajectories of the crystals was downward to the right. Even in very strong updrafts, graupel often fell to the surface in short times and distances.
Figures 5, 6 and 7 show the trajectories of the three crystal types for a maximum vertical wind component of 1 metre/second. Notice for this wind field that graupel falls rapidly to the surface and drifts only a short distance downwind (see Figure 5). Spatials that form in the weaker vertical wind upwind of the ice shelf and at lower latitudes also fall rapidly to the surface and drift short distances downwind (see Figure 6). However, those which start closer to the edge of the ice shelf, where the vertical wind is stronger, are lofted upward and drift almost 500 km downwind before they reach the surface. Planars exhibit a similar pattern as spatials, but many more starting positions will permit crystals to be lofted and drift over 700 km downwind from the edge of the ice shelf (see Figure 7). It is interesting to note that those crystals which are lofted tend to reach the same location on the ground, even though they originate from different starting positions. This result is puzzling and should be confirmed in future research efforts.
Horizontal dispersion of δ18O
Although the trajectories of ice crystals and their precipitation to the ground is interesting in its own right, the primary intent of this investigation is to determine the dispersion of δ18O as a function of distance from the edge of an ice shelf. To find the dispersion of δ18O downwind of the edge of an ice shelf we must compute the position and average δ18O of each ice crystal when it reaches the surface.
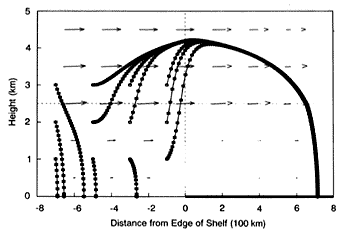
Figure 7. Trajectories of dendritic crystals in a 100 cm/sec maximum vertical wind.
However, the average δ18O of an ice crystal is strongly affected by both its mass rate of growth and the temperature where the growth occurs. The mass growth rate can be computed as a function of crystal diameter from Mason49 for each crystal type:
Graupel: m = 0.065D3 (4)
Spatials: m = 0.010D2 (5)
Planars: m = 0.0038D2 (6)
where m is the mass of a crystal in milligrams and D is the diameter in millimetres.
Numerous researchers report on laboratory and field studies of the fractionation of oxygen isotopes by evaporation from a water surface. However, relatively few deal with the complex process of evaporation from the ocean to fallout as snow. Craig,50,51 Dansgaard,52 Johnsen et al.,53 Jouzel et al.,54–56 and Petit et al.,57 report on the fractionation of oxygen isotopes during the phase change from liquid to vapour. They determined the δ18O in the evaporated water vapour by measuring the δ18O in the residual liquid following a period of evaporation. Johnsen et al.,58 used the following relationship between air temperature and δ18O assuming evaporation from the oceans, transport to the polar regions, and deposition as snow (a phase change from vapour to ice).
δ18O = 0.667T – 13.7℃ (7)
where T (°C) is the air temperature and δ18O is the oxygen isotope ratio of the ice formed. If this relationship is applied to our calculation for a phase change from vapour to ice, where T is the temperature at which the ice crystal is growing, we can calculate δ18O of the most recent layer of ice growth. This is also an approximation which will need refinement in future efforts. If we also know the mass of the most recent growth from Equations 4, 5 and 6, we can find the average δ18O from nucleation to the current position. This calculation will require the vertical temperature distribution in the atmosphere to be prescribed. For this study a surface temperature of 0°C and a lapse rate of 6.4°C/km, the moist adiabatic, was assumed. δ18O of a crystal varies as the crystal grows and moves through different temperature levels. Once it precipitates onto the surface it remains unchanged. The average δ18O from nucleation to fallout by mass-averaging is calculated as follows:
 (8)
(8)
where dm is the infinitesimal amount of mass added
to a crystal at any stage in the growth process, M is the total
mass of a crystal when it reaches the surface, δ18O is the
oxygen isotope ratio of the added mass, and  is the average oxygen isotope ratio of the crystal when it reaches the
surface.
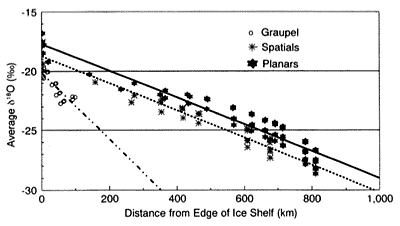
Figure 8. Dispersion of δ18O vs. distance from edge of ice shelf.
Figure 8 shows the dispersion of ![]() using this method.
using this method.  is plotted as a function of distance from the edge of the ice shelf for
each of the three crystal types. In order to fill the domain of this plot
the trajectories for the 12 starting positions shown in Figure 4 were
computed for the three crystal types with maximum vertical velocities
between 0.1 and 5.0 metres/second.
 is found to be inversely proportional to the distance from the edge of
an ice shelf. The farther downwind the precipitation occurs the lower
the value of
  .
This relationship is strongest for ice crystals which have the smallest
terminal velocities. Graupel have the weakest dispersion of
  over distance because the trajectories are so steep that they remain in
the upper atmosphere at cold temperatures for only a brief time. They
do not acquire low average values of
  .
The data near the left-hand side of Figure 8 are produced by lower vertical
wind velocities, and those on the right side by higher velocities. It
is evident that two of the most important parameters for the dispersion
of
  are crystal type and vertical wind velocity.
The values of  were computed strictly from Equation 7. No consideration was given to
the variation of
  as a function of latitude, height, or difference between the time of the
Flood and today. Although some investigators have reported strong variation
of
  in snow as a function of location, it is not known if this is due to space
and time changes or to the effect explored in this paper. It is likely
that if the Flood was as catastrophic as suggested by some, large variations
in
  of the precipitation would be expected with time, at least initially.
Application to ice shelves
It appears that we now have a powerful mechanism for explaining the oxygen isotope trends in ice cores. If an ice core is drilled through an ice sheet on Greenland or Antarctica, it contains the record of δ18O which precipitated at a given location. If the site of the ice core was a short distance from the open ocean (say 200 km) at the time the snow at the bottom of the ice core fell, the value of δ18O would be about –18℃ according to Figure 8. However, if an ice shelf were forming over the open ocean so that the distance was slowly increasing to 1,000 km or so, the value of δ18O would decrease to about –28℃.
If a sudden reversal in the growth of the ice shelf occurred, causing the distance to decrease rapidly to 400 km or so, the value of δ18O would increase rapidly to –23℃. If the shelf were to remain fixed at a constant distance from the ice core site, the trend in δ18O would approximate the trend observed in the upper portion of the ice cores as shown in Figures 1, 2 and 3. It is interesting that Camp Century is the farthest north and likely had the longest trajectory over an ice shelf. δ18O exhibits the greatest change at Camp Century. The ice cores from Dye or Summit should produce a similar trend, but the magnitude of δ18O would probably be different. The different distance from the open ocean to the core site should be taken into account. The real atmospheric wind fields have also not been considered. Many of the assumed relationships in this first model will probably need major revision when applied to different locations.
Conclusions and recommendations
It would appear that this simple, first model for the dispersion of δ18O as a function of distance from the edge of a growing or retreating ice shelf has been successful in providing an alternative explanation for the observed oxygen isotope trends in ice cores. We can tentatively conclude that a major portion of the slow decrease in δ18O with time during the early portions of the latest ice age, followed by a rapid increase in δ18O during the deglaciation, could be due to the slow growth and subsequent rapid melting of an ice shelf on the upwind ocean rather than slow cooling and rewarming of the ocean itself.
It is also evident that much work remains to be done to improve these calculations. Only simple average relationships were used. Prescriptive rather than prognostic wind fields were used. More complete cloud physics should be incorporated. An Eulerian as well as Lagrangian system should be modeled. The relation between temperature and oxygen isotope fractionation during a phase change from vapour to ice should be improved. The magnitude of δ18O near the bottoms of various cores, at the ice age minima of δ18O, and at the uniform upper portions of the cores, should be correlated with distance from the ocean, dynamics and cloud physics to determine if this information will provide insights into the boundary conditions.
Finally, if the growth and retreat of ice shelves is an adequate explanation for δ18O trends in ice cores, 100,000 years is no longer needed to explain the ice age. Vardiman59 has already developed an adequate explanation for the accumulation of large quantities of ice in polar regions over short periods of time. The growth and decay of ice shelves could also occur over short periods of time, permitting the young-earth model of the Ice Age to explain the trends in δ18O of ice cores.
Acknowledgments
Computations for this article were conducted on computer equipment provided by Steve Low and his associates at the Hewlett-Packard Company. Thanks to Ed Holroyd and Mike Oard who graciously provided in-depth reviews of this article.
Larry Vardiman has a Ph.D. in atmospheric science from Colorado State University, Fort Collins. He is chairman of the Astrogeophysics department at the Institute for Creation Research Graduate School in Santee, California, from where he has made a number of significant contributions to creationist research.
References
- Vardiman, L., Ice Cores and the Age of the Earth, ICR Monograph, San Diego, California, pp. 86, 1993.
- Clausen, H.B. and Langway, C.C., Jr., The ionic deposits in polar ice cores. In: The Environmental Record in Glaciers and Ice Sheets, H. Oeschger and C.C. Langway Jr. (eds), John Wiley and Sons Ltd, New York, pp. 225–247, 1989.
- Dansgaard, W., Johnsen, S.J., Möller, J. and Langway, C.C., Jr., One thousand centuries of climatic record from Camp Century on the Greenland Ice Sheet, Science 166:377–381, 1969.
- Dansgaard, W., Johnsen, S.J., Clausen, H.B. and Langway, C C., Jr., Climatic record revealed by the Camp Century ice core. In: Late Cenozoic Glacial Ages, K K. Turekian (ed.), Yale University Press, New Haven and London, pp. 37–56, 1971.
- Dansgaard, W., Clausen, H.B., Gundestrup, N., Hammer, C.U., Johnsen, S.J., Kristindottir, R.M. and Reeh, N., A new Greenland deep ice core, Science 218:1273–1277, 1982.
- Dansgaard, W. and Oeschger, H., Past environmental long-term records from the Arctic. In: The Environmental Record in Glaciers and Ice Sheets, H. Oeschger and C. C. Langway Jr.(eds), John Wiley and Sons Ltd, New York, pp. 287–318, 1989.
- Garfield, D.E. and Ueda, H.T., Drilling through the Greenland Ice Sheet, U. S. Army CRREL, Special Report #126, 1968.
- Hammer, C.U., Dating by physical and chemical seasonal variations and reference horizons. In: The Environmental Record in Glaciers and Ice Sheets, H. Oeschger and C. C. Langway Jr. (eds), John Wiley and Sons Ltd, New York, pp. 99–121, 1989.
- Hammer, C.U., Clausen, H.B. and Dansgaard, W., Greenland ice sheet evidence of post-glacial volcanism and its climatic impact, Nature 288:230–235, 1980.
- Hammer, C.U., Clausen, H.B., Dansgaard, W., Neftel, A., Krisindottir, R and Johnsen, E., Continuous impurity analysis along the Dye 3 deep core. In: Greenland Ice Core: Geophysics, Geochemistry, and Environment, Geophysical Monograph 33, pp. 90–94, 1985.
- Hammer, C.U., Clausen, H.B. and Tauber, H., Ice-core dating of the Pleistocene/Holocene boundary applied to a calibration of the 14C time scare, Radiocarbon 28:284–291, 1986.
- Johnsen, S.J., Stable isotope homogenization of polar firn and ice. In: Isotopes and Impurities in Snow and Ice, Proceedings IU66 Symposium 118, pp. 210–219, 1977.
- Johnsen, S.J., Dansgaard, W., Clausen, H.B. and Langway, C.C., Jr., Oxygen isotope profiles through the Antarctic and Greenland ice sheets, Nature 235:429–434, 1972.
- Johnsen, S.J., Dansgaard, W. and White, J.W.C, The origin of Arctic precipitation under present and glacial conditions, Tellus 41B:452–468, 1989.
- Langway, C.C., Jr., Stratigraphic Analysis of a Deep Ice Core from Greenland, US Army CRREL, Research Report #77, 1967.
- Ueda, H.T. and Garfield, D.E., Drilling through the Greenland Ice Sheet, U. S. Army CRREL, Technical Report #126, pp. 7, 1968.
- Garfield, D.E., Drill Hole Measurements at Byrd Station, US Army CRREL, Internal Report #58, 1968.
- Gow. A.J., Results of measurements in the 309-meter bore hole at Byrd Station, Antarctica, Journal of Glaciology 4:36, 1963.
- Johnsen et al., Ref. 13.
- Lorius, C., Merlivat, L., Jouzel, J. and Pourchet, M., A 30,000-yr isotope climatic record from Antarctic ice, Nature 280:644, 1979.
- Lorius, C., Jouzel, J., Ritz, C., Merlivat, L., Barkov, N.I., Korotkevich, Y.S. and Kotlyakov, V.M., Nature 316:591, 1985.
- Merlivat, L. and Jouzel, J., Global climatic interpretation of the deuterium-oxygen 18 relationship for precipitation, Journal of Geophysical Research 84:5029–5033, 1979.
- Petit, J.R. Briat, M. and Royer, A., Ice age aerosol content from East Antarctic ice core samples and past wind strength, Nature 293:391–394, 1981.
- Petit, J.R., Mounier, L., Jouzel, J., Korotkevich, Y.S., Kotlyakov, V.I. and Lorius, C., Paleoclimatological and chronological implications of the Vostok core dust record, Nature 343:56–58, 1990.
- Petit, J.R. White, J.W.C., Young, N.W., Jouzel, J. and Korotkevich, Y.S., Deuterium excess in recent Antarctic snow, Journal of Geophysical Research 96:5113–5122, 1991.
- Ueda, H.T. and Garfield, D.E., Core Drilling through the Antarctic Ice Sheet, U. S. Army CRREL, Technical Report #231, 1969.
- Ueda, H.T. and Hansen, B.L., Installation of deep core drilling equipment at Byrd Station (1966–67), Antarctic Journal 2:4, 1967.
- Vardiman, Ref. 1.
- Kennett, J.R. Houtz, R.E., Andrews, R.B., Edwards, A.R., Gostin, V.A., Hajos, M., Hampton, M., Jenkins, D.G., Margolis, S.V., Ovenshine, A.T. and Perch-Nielson, K., Descriptions of procedures and data for Sites 277, 279, and 281 by the shipboard party. In: Initial Reports of the Deep Sea Drilling Project 29:45–58, 191–202 and 271–285, Government Printing Office, Washington, D. C., 1977.
- Savin, S.M., Douglas, R.G. and Stehli, F.G., Tertiary marine paleotemperatures, Geological Society of America Bulletin 86:1499–1510, 1975.
- Shackleton, N.J. et al., Oxygen isotope calibration of the onset of ice-rafting and history of glaciation in the North Atlantic region, Nature 307:620–623, 1984.
- Vardiman, L., Sea-Floor Sediment and the Age of the Earth, ICR Monograph, San Diego, California, pp. 94, 1996.
- Milankovitch, M., Mathematische Klimalehre und astronomische Theorie der Klimaschwankungen. In: Handbuch der Klimatologie, I. W. Koppen and R. Geiger (eds), Gebrudr Borntraeger, Berlin, 1930.
- CLIMAP, The surface of the ice-age earth, Science 191 :1131–1144, 1976.
- CLIMAP, Seasonal reconstructions of the earth's surface at the last glacial maximum, Geological Society of America, Map and Chart Series No. 36, 1981.
- Hays, J.D., Imbrie, J. and Shackleton, N.J., Variations in the Earth's orbit: pacemaker of the Ice Ages, Science 194:1121 –1132, 1976.
- Hays et al., Ref. 36.
- Alley, R.B., Shuman, C.A., Meese, D.A., Gow, A.J., Taylor, K.C., Ram, M., Waddington, E.D. and Mayewski, P.A., An old, long, abrupt Younger Dryas event in the GISP2 ice core, Proceedings of the 1992 Fall Meeting of the American Geophysical Union, San Francisco, 1992.
- Alley, R.B., Meese, D.A., Shuman, C.A., Gow, A.L., Taylor, K.C., Grootes, R.M., White, J.W.C., Ram, M., Waddington, E.D., Mayewski, P.A. and Zielinski, G.A., Abrupt increase in Greenland snow accumulation at the end of the Younger Dryas Event, Nature 362:527–529, 1993.
- Vardiman, Ref. 1.
- Vardiman, Ref. 1.
- Bowen, R. Isotopes and Climate, Elsevier Applied Science, London, pp. 483, 1991.
- Petit et al., Ref. 25
- Alley et al., Ref. 38.
- Alley et al., Ref. 39
- Kelvin, Lord, Popular Lectures and Addresses (1889–1894), Macmillan, London, Three volumes, 1889.
- Ryan, B.F., Wishart, E.R. and Shaw, D.E., The growth rates and densities of ice crystals between –3°C and –21°C, Journal of the Atmospheric Sciences 33:842–850, 1976.
- Mason, B. J., The Physics of Clouds, Second edition, Clarendon Press, Oxford, pp. 671, 1971.
- Mason, Ref. 48.
- Craig, H., Isotope variations in meteoritic waters, Science 133:1702–1703, 1961.
- Craig, H., The measurement of oxygen isotope paleotemperatures, Proceedings of the Spoleto Conference on Stable Isotopes in Oceanographic Studies of Paleotemperatures 3:1–24, 1965.
- Dansgaard, W., Stable isotopes in precipitation, Tellus 16:436–468, 1964.
- Johnsen et al., Ref. 14.
- Jouzel, J., Malivat, L. and Lorius, C., Deuterium excess in an East Antarctic ice core suggests higher relative humidity at the oceanic surface during the last glacial maximum, Nature 299:688–691, 1982.
- Jouzel, J. and Merlivat, L., Deuterium and oxygen 18 in precipitation: modeling of the isotopic effect during snow formation, Journal of Geophysical Research 89:11749–11757, 1984.
- Jouzel, J., Russel, G.L., Suozzo, R.J., Koster, R.O., White, J.W.C. and Broecker, W.S., Simulations of HDD and H2180 atmospheric cycles using the NASA GISS general circulation model: the seasonal cycle for present day conditions, Journal of Geophysical Research 92:14739–14760, 1987.
- Petit et al., Ref. 25.
- Johnsen et al., Ref. 14.
- Vardiman, Ref. 1.

Answers in Genesis is an apologetics ministry, dedicated to helping Christians defend their faith and proclaim the good news of Jesus Christ.
- Customer Service 800.778.3390
- Available Monday–Friday | 9 AM–5 PM ET
- © 2025 Answers in Genesis
