The views expressed in this paper are those of the writer(s) and are not necessarily those of the ARJ Editor or Answers in Genesis.
Abstract
How are all life forms connected? Are they linked by one giant family tree, a web, or a forest of family trees? Here I propose to use taxonomically restricted essential genes and essential non-coding DNA elements to determine whether two organisms can be two branches of the same family tree, or can share a common ancestor that is simpler than the two organisms, based on the following reasons: 1) All essential genes and essential non-coding DNA elements of an organism are indispensible for its survival. 2) Spontaneous mutation accumulation experiments show that experimentally-identified spontaneous mutations are mostly single base substitutions, small (<13 base pairs) indels, and rearrangements of DNA segments. No novel genes have been observed to emerge. 3) Targeted mutagenesis experiments show that functional arrangements of amino acids are extremely rare; one in 1077 for a typical protein domain with 153 amino acids. 4) Both mutation accumulation experiments and studies of symbiotic organisms show that genes that are not used tend to be degenerated or totally deleted. 5) For each constructive path to a new functional gene, there are many disruptive sidetracks. These sidetracks may prevent the cells from taking a constructive path that is of no immediate use, however beneficial it might be theoretically. In essence, the very nature of the essential genes and of the essential non-coding DNA elements of an organism, and the inability of mutation and natural selection to create novel genes, argue that two taxa, each with its own taxonomically restricted essential genes and essential noncoding DNA elements, cannot have shared and evolved from a simpler common ancestor. Analyses of the taxonomic distribution of essential genes and essential non-coding DNA elements of six bacteria and five eukaryotes show that no two of them can belong to the same family tree, which indicates that life forms on earth are best represented as a forest of family trees.
Keywords: common ancestor, mutations, origin of life, tree of life, lineage specific genes, orphan genes, origin of species, evolution, gene gain, gene loss
Disclaimer: The opinions expressed in this paper are the author’s own and not necessarily those of the University of Missouri.
Introduction
Three predominant views on the origin and relationship of organisms on earth are: 1) One family tree connects them all, 2) A forest of family trees connects them, and 3) a web connects them. The concept of a web of life, in which genes are transferred not only vertically through parents to offspring but also horizontally or laterally between different lineages, is proposed because “as the sequences from genome projects accumulate, molecular datasets become massive and messy, with the majority of gene alignments presenting odd (patchy) taxonomic distributions and conflicting evolutionary histories . . . the expected proportion of genes with genuinely discordant evolutionary histories has increased from limited to substantial” (Leigh et al. 2011) and “the more we learn about genomes the less tree-like we find their evolutionary history to be, both in terms of the genetic components of species and occasionally of the species themselves”(Bapteste et al. 2013). According to the web of life model, it is impossible to clearly determine, molecularly, the phylogeny of all the organisms on earth. However, our daily experiences and experimental observations tell us that the norm of gene flow is from parents to offspring, demonstrating the reality of family trees rather than a web. Furthermore, the seemingly weblike relationship of life can be an artifact of forcing a forest of family trees into a single family tree. Therefore, determining which of the three views on the origin of life is correct can be simplified to determining whether two organisms belong to two different branches of one family tree or to two separate family trees.
With the publication of Darwin’s book on the origin of species (Darwin 1859) and the works of his followers, the concept of one family tree of life has taken root in many people’s hearts. Even though a group of renowned geologists, paleontologists, ecologists, geneticists, and developmental biologists concluded that what is seen in microevolution cannot be extrapolated to macroevolution (Lewin 1980), and more recently a group of distinguished evolutionists called for a paradigm shift in evolution (Bapteste et al. 2013), the concept of one family tree of life refuses to leave the stage. Here I will use taxonomically restricted essential genes (TREGs), also called lineage-specific essential genes, and experimental observations on mutations, both spontaneous and engineered, to argue that life on earth is best described as connected by a forest of family trees.
A. Theoretical Consideration
An essential gene is a gene in an organism that is necessary for the viability of the organism (by extension, genes responsible for its reproduction are also essential genes since a lineage terminates without reproduction). Thus, an organism dies when any one of its essential genes does not function properly and it will not exist until all its essential genes exist. A TREG is an essential gene in an organism that is unique to a specific taxon of organisms. For example, bacterial dnaA gene is unique to the bacterial domain; no such gene has been identified in eukaryotes (Tan and Tomkins 2015b).
A logical conclusion from the nature of essential genes is that an organism A cannot evolve into another organism B that contains organism B-specific essential genes, i.e. genes that are necessary for the survival of organism B but do not have homologs in organism A. In other words, all essential genes of an organism must have homologs in its ancestor, though these homologs may not be necessary for the survival of the ancestor.
Could it be possible that organisms A and B are both derived from a simpler common ancestor, CA, that evolved through two paths, one gained A-specific essential genes and evolved into A and the other gained B-specific essential genes and evolved into B? In other words, the CA evolved into two organisms A and B, each obtaining its special essential genes that do not have homologs in CA. This, in effect, just doubles the demands, and the impossibility, than for B evolves from A. Therefore, two taxa each with its own private TREGs cannot evolve from each other or have shared and evolved from a simpler common ancestor by gene gain. That is, they do not belong to the same family tree with more primitive (or simpler) common ancestors.
Alternatively, A and B could have derived from a more complicated ancestor by gene loss. The problem with this scenario is that we then need to answer the question where the complicated ancestor came from. In other words, even proven true, it does not help to answer the question where, ultimately, various organisms with different TREGs come from.
One may argue that new genes may be generated via accumulated mutations in organism A, resulting in transitional organisms A1, A2 . . . and, eventually, organism B. I will address this question in the sections on gene gain and gene loss.
Note that homologs are often equated to sharing a common ancestor. However, homology can be due to common design, convergent evolution, or lateral gene transfer. In this essay two genes are considered homologous as long as they share some sequence similarity, regardless of their origin. If two homologous genes are protein coding, then the protein sequence of one gene would show up as a hit with an expect (E) value of 10-4 or smaller using the protein sequence of the other gene as a query sequence in a BLASTp (Basic Local Alignment Search Tool, protein to protein) search in the National Center for Biotechnology Information (NCBI) database (http://blast.ncbi.nlm.nih.gov/Blast.cgi). E-value is a parameter that describes the number of hits one can “expect” to see by chance when searching a database of a particular size and is equal to the possibility of a hit multiplying the size of the database. The similarity between two homologs can be very limited. For example, the archaea Haloferax volcanii translation initiation factor aIF5A is called a homolog of eukaryotic translation initiation factor eIF5A, although only less than ten amino acids of the 124 amino acids of aIF5A (HVO-2300) aligned with some amino acids in eIF5A (Gabel et al. 2013; Tan and Tomkins 2015a). In a BLASTp search (performed 9/23/2015) in the NCBI non-redundant protein sequences, eIF5A did not show up as a hit as a homolog of HVO-2300, while in the NCBI Non-redundant UniProtKB/SwissProt sequences, eIF5A did so with E-values from 2e-11 to 3e-6 in several eukaryotes including Caenorhabditis elegans, Saccharomyces cerevisiae, and Homo sapiens (human). The latter search also identified elongation factor P as a hit with E-values from 6e-5 to 0.002 in bacteria Campylobacter lari RM2100 (6e-05), Wolinella succinogenes DSM 1740 (7e-05), Campylobacter jejuni subsp. Jejuni (3e-04), and Desulfovibrio salexigens DSM 2638 (0.002).
It is worth pointing out that taxonomically restricted non-essential genes may also be very important for the life of an organism. For example, the genes involved in human language are the very factors that made human cultures possible. However, survival and reproduction could occur without language. Thus, linguistic genes are not necessary for the survival or reproduction of humans. Similarly, other genes involved in determining our voices, fingerprints, or sound of our footsteps, length of our fingers, etc., are important for our identification, for distinguishing one person from another, or for some specific skills, but they are not required for the survival and reproduction of humans. Therefore, by focusing on TREGs, we are considering only the minimal requirement for the existence of an organism.
B. Taxonomically Restricted Genes
Taxonomically restricted genes (TRGs) are genes that are unique to a specific taxon of organisms (Tomkins and Bergman 2013; Wilson et al. 2005, 2007). They can be at any taxonomic rank, including domain, phylum, class, order, family, genus, or species. For example, an order-specific human gene will have homologs in non-human primates but not in non-primate organisms. A species-specific human gene is one that is unique to humans. None of its homologs exist in chimpanzee or any other organisms. A few hundred of such human-specific genes have been identified and some of them are implicated in brain function and male reproduction (Demuth et al. 2006; Guerzoni and McLysaght 2011; Wu, Irwin, and Zhang 2011; Zhang and Long 2014), though the results need to be confirmed with genomic comparisons of more organisms as discussed later. Interestingly, in the search for de novo human protein-coding genes, Wu and colleagues discarded the human TRGs because no orthologous DNA sequences could be identified in chimpanzee or orangutan (Wu, Irwin, and Zhang 2011).
Many instances of TRGs have been reported (Arendsee, Li, and Wurtele 2014; Khalturin et al. 2009; Neme and Tautz 2013; Tautz and Domazet-Lošo 2011; Toll-Riera et al. 2009; Wissler et al. 2013; Yang et al. 2013). Strikingly, opposite to earlier expectation, each newly sequenced genome adds a significant number of TRGs (Albertin et al. 2015; Arendsee, Li, and Wurtele 2014; Neme and Tautz 2013; Tautz and Domazet-Lošo 2011; Toll-Riera et al. 2009; Wissler et al. 2013).
To determine the exact number and the identity of TRGs in an organism, we need accurate sequences and careful and thorough annotations of genomes of many organisms because sequence errors or annotation errors do occur and can be very misleading (Hayashi et al. 2006). According to the Genomes Online Database, by 7/16/2015, 63851 genomes (1078 archaea, 45,076 bacteria, and 9059 eukaryotes) have been completely or partially sequenced (https://gold. jgi-psf.org), although most of these genomes have not been fully annotated. Improved annotation of these sequences will provide a huge amount of raw material for the identification of TRGs in many organisms.
The use of TRGs as evidence for or against two organisms belonging to the same family tree depends on the function and the origin of TRGs. If their functions are non-essential for the sustaining or propagation of their host organisms, or if, despite being functionally essential, they can be generated naturally by random mutations, then their existence cannot be used to determine whether the two organisms belong to one or two family trees. However, if they are essential and cannot be naturally generated (i.e., they are TREGs, not just TRGs), then two organisms that each contains its own distinct TREGs could not have evolved from each other or share a simpler common ancestor since each TREG creates an evolutionally unbridgeable gap between the two. In the following sections, I will first discuss the functions of TRGs in the survival of organisms (sections C and D) and then whether they can be generated via natural mutation and selection (sections E-G).
C. Taxonomically Restricted Essential Genes
Three things should be kept in mind when considering essential genes. First, even the simplest prokaryotic cells require hundreds of essential genes. For example, the organism with the smallest known genome that can constitute a cell, the parasitic bacterium Mycoplasma genitalium, contains 381 essential genes, 79% of its annotated 482 proteincoding genes (Glass et al. 2006). Note that to die is not the most interesting phenotype; rather, it is an extreme phenotype. Thus, to survive is only the minimum. Second, there are many genes that are not essential on their own but are essential when deleted along with another nonessential gene. This well-known genetic phenomenon is called synthetic lethality (Tucker and Fields 2003). Therefore, we do not know how many additional genes in the M. genitalium genome are required for its survival, once synthetic lethality is considered. Studies in yeast show that synthetic lethal is a common phenomenon (Baryshnikova et al. 2013; Costanzo et al. 2010; Kaboli et al. 2014; Tong et al. 2001, 2004). Of the 6200 Saccharomyces cerevisiae genes, about 5100 are non-essential for cell viability. In contrast, a study covering ~30% of the genome identified 10,000 synthetic lethal pairs, and it is estimated that S. cerevisiae contains over 200,000 synthetic lethal combinations, 200-fold more than the number of yeast essential genes (Baryshnikova et al. 2013; Costanzo et al. 2010). Third, not all essential genes are required for the survival of its host organisms at all growth conditions, i.e. some genes are only conditionally essential (Hillenmeyer et al. 2008; Ramani et al. 2012). For example, yeast genes involved in galactose metabolism are essential only when the sole carbon source of yeast is galactose. Thus, the exact list of essential genes for an organism may change depending on the experimental conditions. Normally, when determining what genes are essential for an organism, the organism is provided with an optimal growth environment with all necessary nutrients, a non-stressful situation that is least demanding for the organism. Thus, we will limit the essential gene lists to those required for the survival of organisms under their optimal growth conditions.
To determine whether there are TREGs, essential genes from several model organisms are grouped according to their taxonomic distribution, or apparent evolutionary age—the proposed “evolutionary origin of a gene, defined by the evolutionarily most distant species where homologs can be found” (Chen et al. 2012a; Wolf et al. 2009), based on the online gene essentiality database (OGEE, http://ogeedb.embl.de/, [Chen et al. 2012a]) (figs. 1 and 2, table 1). For example, the Escherichia coli genes were divided into six groups: 1) Cellular organism group, which can be found in both bacteria and eukaryotes (note that archaea was not counted as a domain separate from bacteria in the analysis); 2) Bacteria group, which can be found in proteobacteria and some non-proteobacteria bacteria but not outside bacteria; 3) Proteobacteria group, which can be found in gammaproteobacteria and some non-gammaproteobacteria proteobacteria but not outside proteobacteria; 4) Gammaproteobacteria group, which can be found in enterobacteriaceae and some non-enterobacteriaceae gammaproteobacteria but not outside gammaproteobacteria; 5) Enterobacteriaceae group, which can be found in E. coli and some non-E. coli enterobacteriaceae but not outside enterobacteriaceae; and 6) Not assigned group. The sixth group includes those genes of which no homologs could be found in other organisms at the time the OGEE database was generated. Some genes of this group are E. coli specific. Therefore, group one E. coli genes are shared between bacteria and eukaryotes; groups two to six are specific to the bacteria domain (fig. 1A, boxed with dash-dot-dot line); groups three to six are specific to the proteobacteria phylum (fig. 1A, boxed with dash-dot line); group four to six are specific to the gammaproteobacteria class (fig. 1A, boxed with dotted line); group five to six are specific to the enterobacteriaceae family. Note that a family-restricted TREG is also an order-restricted TREG, which is also a class-restricted TREG, which is also a phylum-restricted TREG, which is also a domain-restricted TREG.
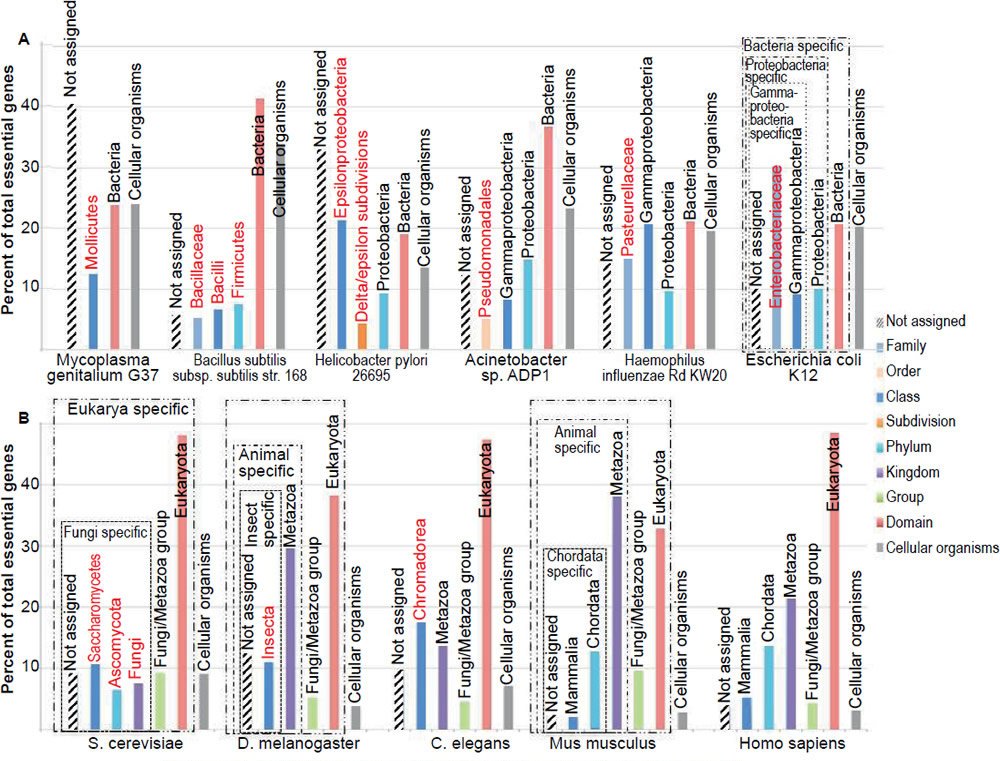
Fig. 1. Taxonomic distributions of the essential genes of different organisms. (A) Six bacteria. (B) Five eukaryotes. All genes are grouped according to their apparent evolutionary age. The groups labeled with red letters do not have homologs in any of the other organisms shown in the figure. All data in figs. 1 to 4 are from the online gene essentiality database (OGEE, http://ogeedb.embl.de). The distributions of the various groups were obtained by running analyses of specific datasets with the feature “phyletic age” on the OGEE website. Detailed data can be found in Table 1, including dataset used, total genes analyzed, and criteria used to judge whether a gene is essential or not in each experiment.
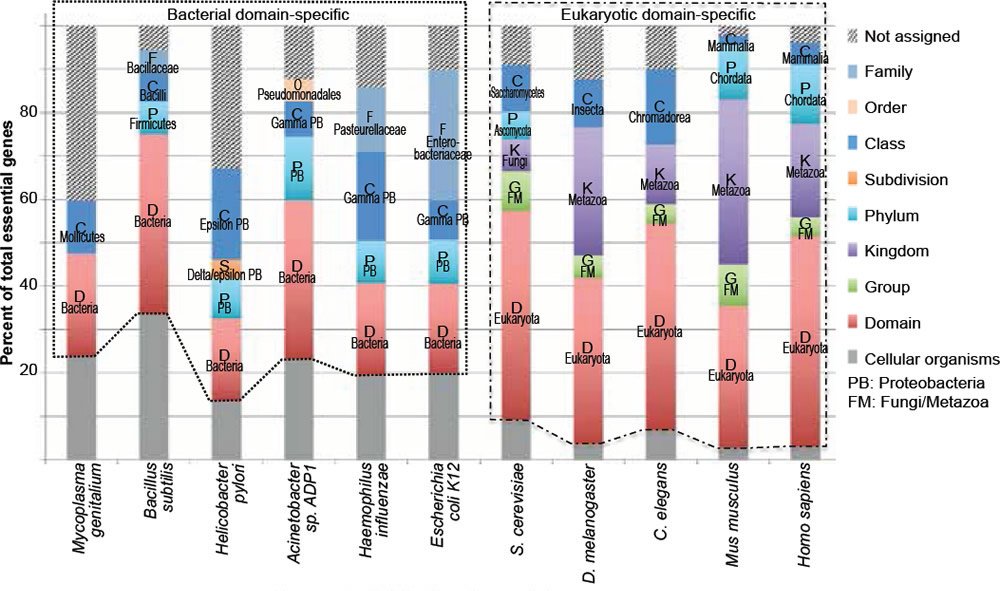
Fig. 2. The vast majority of essential genes are taxonomically restricted, though differ at the taxonomic ranks of restriction. This graph was generated using the same data as those in Fig. 1, only presented as stacked columns. Bacteria-specific essential genes are boxed with dotted lines, while eukaryotic-specific ones boxed with dash-dotted lines. Letters in the columns are the first letters of taxonomic ranks.The same coloring and labeling scheme is used in figs. 3 to 5.
| Organisms | Percentage of different groups with apparent age of genes analyzed | Total gene number | Definition of essential genes | |||||||||||
|---|---|---|---|---|---|---|---|---|---|---|---|---|---|---|
| Cellular | Domain | Group | Kingdom | Phylum | Subdivision | Class | Order | Family | Not assigned | |||||
| Bacteria | Mycoplasma genitalium (357) | EG | 23.9 | 23.6 | 12.3 | 40.2 | 381 | Genes were asserted to be essential or nonessential based on the occurrence of transposen inserts within each ORF and the overall insertion density in the local environment. |
||||||
| GA | 22.1 | 21.5 | 12.6 | 43.8 | 475 | |||||||||
| AG | 22.1 | 21.5 | 12.6 | 43.8 | 475 | |||||||||
| Bacillus subtilis (352) | EG | 33.8 | 41.2 | 7.5 | 6.6 | 5.3 | 5.7 | 228 | ||||||
| GA | 16.9 | 13.4 | 11.7 | 4.4 | 19.2 | 34.4 | 4176 | |||||||
| AG | 16.9 | 13.4 | 11.7 | 4.4 | 19.2 | 34.4 | 4176 | |||||||
| Helicobacter pylori (356) | EG | 13.6 | 19.0 | 9.3 | 4.2 | 21.1 | 32.8 | 332 | ||||||
| GA | 14.3 | 15.0 | 9.3 | 4.0 | 19.8 | 37.6 | 1467 | |||||||
| AG | 13.7 | 14.0 | 8.7 | 3.8 | 19.0 | 40.8 | 1573 | |||||||
| Acinetobacter sp. ADP1 (351) | EG | 23.2 | 36.5 | 14.7 | 8.2 | 5.1 | 12.3 | 293 | ||||||
| GA | 11.1 | 15.7 | 12.6 | 9.3 | 14.8 | 36.5 | 3195 | |||||||
| AG | 10.7 | 15.2 | 12.2 | 9.1 | 14.4 | 38.5 | 3307 | |||||||
| Haemophilus influenzae (365) | EG | 19.6 | 21.1 | 9.8 | 20.4 | 15.0 | 14.1 | 460 | ||||||
| GA | 19.7 | 17.7 | 10.5 | 21.5 | 15.7 | 15.0 | 974 | |||||||
| AG | 18.0 | 18.3 | 9.8 | 21.4 | 14.5 | 17.9 | 1657 | |||||||
| Escherichia coli K12 (367) | EG | 20.0 | 20.5 | 10.1 | 9.1 | 30.1 | 10.1 | 604 | ||||||
| GA | 18.8 | 13.0 | 10.7 | 9.9 | 35.9 | 11.7 | 3527 | |||||||
| AG | 17.3 | 12.1 | 10.0 | 9.7 | 35.7 | 15.2 | 4145 | |||||||
Eukarya |
Saccharomyces cerevisiae (350) | EG | 9.2 | 48.1 | 9.2 | 7.4 | 6.4 | 10.5 | 9.2 | 1049 | Genes whose removal result in lethal phenotype (growth inhibition) |
|||
| GA | 6.4 | 29.5 | 8.6 | 10.6 | 6.3 | 10.8 | 27.8 | 5635 | ||||||
| AG | 6.3 | 28.9 | 8.4 | 10.4 | 6.2 | 10.6 | 29.6 | 5868 | ||||||
| Drosophila melanogaster (347) | EG | 3.7 | 38.2 | 5.2 | 29.6 | 10.9 | 12.4 | 267 | A z score signifies the severity or rank of specific RNAi phenotypes created by the authors; genes with z-scores higher than 3 are defined as essential. |
|||||
| GA | 3.0 | 24.8 | 6.0 | 26.8 | 16.6 | 22.8 | 13,781 | |||||||
| AG | 3.0 | 24.8 | 6.0 | 26.8 | 16.6 | 22.8 | 13,781 | |||||||
| Caenorhabditis elegans (346) | EG | 7.0 | 47.4 | 4.6 | 13.6 | 17.5 | 9.8 | 742 | Genes whose removal result in lethal or infertile phenotype. |
|||||
| GA | 2.0 | 15.1 | 3.2 | 16.0 | 46.4 | 17.2 | 11,446 | |||||||
| AG | 2.0 | 15.1 | 3.2 | 16.4 | 43.6 | 19.8 | 20,426 | |||||||
| Mus musculus (349) | EG | 2.8 | 32.7 | 9.5 | 38.0 | 12.6 | 2.1 | 2.3 | 2618 | |||||
| GA | 2.6 | 27.3 | 7.7 | 36.1 | 16.9 | 6.7 | 2.8 | 6038 | ||||||
| AG | 2.2 | 22.9 | 5.3 | 23.2 | 20.6 | 8.7 | 17.0 | 23,041 | ||||||
| Homo sapiens (348) | EG | 3.1 | 48.5 | 4.3 | 21.4 | 13.6 | 5.2 | 3.8 | 1528 | Genes whose reduced expression by RNAi lead to inhibition of growthin any of the five tested cell lines. |
||||
| GA | 2.6 | 25.5 | 5.8 | 25.6 | 20.2 | 9.3 | 11.0 | 20,684 | ||||||
| AG | 2.6 | 25.5 | 5.8 | 25.6 | 20.2 | 9.3 | 11.0 | 20,684 | ||||||
Fig. 2 is generated with the same data as Fig. 1 but different groups are presented as stacked columns instead of clustered columns. Several conclusions can be drawn from the taxonomic distributions of essential genes in the six bacteria and five eukaryotes analyzed (figs. 1 and 2).
First, most of the essential genes are taxonomically restricted, for each of the organisms analyzed (fig. 2, compare the non-gray segments of each column with its gray segment). The TREGs differ in their taxonomic distribution; some of them are restricted to specific domains, some to specific phylum, some to specific order, some to specific family. Some are even restricted to specific species. For example, in the group of “not assigned” of E. coli and S. cerevisiae essential genes, I found two (b2450/access number P76550.2 and b1572/access number P29009.1) E. coli specific and two (YEL035C/access number AAS56770.1 and YPL124W/access number P33419.1) S. cerevisiae specific. Of the four E. coli or S. cerevisiae specific genes, only the function of YPL124W is known. It is a component of, and is required for, the duplication of the spindle pole body (http://ogeedb.embl.de/).
Second, the vast majority (78.6%, table 2) of bacterial essential genes are bacterial domain specific (fig. 2, boxed with dotted lines) and even a higher percentage (95.5%) of eukaryotic essential genes is eukaryotic domain specific (fig. 2, boxed with dash-dotted lines). Some of these domain restricted essential genes are genes necessary for DNA replication, including bacterial dnaA, dnaB, dnaC, and dnaE, as well as all the subunits of eukaryotic DNA polymerase alpha ([Tan and Tomkins 2015a, b] and http://ogeedb.embl.de/). When all the organisms analyzed are considered together, only a mere 9.1% of their essential genes are universal, having homologs in both bacteria and eukaryotes, and thus belong to the group of cellular organism genes (table 2, gray segments in fig. 2). It appears that the more complicated an organism is, the smaller the percentage of its universal essential genes becomes, from the 22.3% of E. coli essential genes, to 9.2% of yeast, to 2.8% of mice. Furthermore, many of the essential genes exist in only one phylum or one class or even one family.
| Genes analyzed | Essential genes | All genes encoded | |||||
|---|---|---|---|---|---|---|---|
| number | percentage | number | percentage | number | percentage | ||
| All organisms analyzed | cellular group | 3918 | 5.5 | 771 | 9.1 | 4610 | 4.6 |
| other groups | 67,480 | 94.5 | 7731 | 90.9 | 94,541 | 95.4 | |
| total | 71,398 | 100.0 | 8502 | 100.0 | 99,151 | 100.0 | |
| Bacteria | cellular group | 2232 | 16.2 | 492 | 21.4 | 2396 | 15.6 |
| other groups | 11,582 | 83.8 | 1806 | 78.6 | 12,937 | 84.4 | |
| total | 13,814 | 100.0 | 2298 | 100.0 | 15,333 | 100.0 | |
| Eukaryotes | cellular group | 1686 | 2.9 | 279 | 4.5 | 2214 | 2.6 |
| other groups | 55,898 | 97.1 | 5925 | 95.5 | 81,604 | 97.4 | |
| total | 57,584 | 100.0 | 6204 | 100.0 | 83,818 | 100.0 | |
The large number of the domain-restricted bacterial and eukaryotic essential genes (fig. 2, compare the boxed regions with the gray regions) suggests that life on earth is linked by at least two separated family trees, one for bacteria and another for eukaryotes. This is because, as mentioned earlier, an organism cannot survive unless all its essential genes are functional. Therefore, it is impossible for organism “A” to evolve into another organism, “B”, unless they share the same essential genes, at least A should contain all the genes essential for B because B will not survive until it has all its essential genes, although these genes may not be necessary for the survival or propagation of organism A. Therefore, two lineages that differ in TREGs could not have shared and evolved from a simpler common ancestor. Thus, if each domain/phylum/class/order/family/genus contains phylum/class/order/family/genus-specific essential genes, then they could not have derived naturally from the same simple ancestor, unless multiple new genes can pop up simultaneously via mutations, an unlikely process based on studies on spontaneous mutation and targeted mutagenesis that will be discussed later.
One may argue that the eukaryotes and prokaryotes separated a long time ago, and have evolved separately since then. The original split is long forgotten, and so are the genes that used to connect the two. So, we shouldn’t expect homologs in many genes between eukaryotes and prokaryotes. The argued scenario is unlikely what has happened in the history of life because, as will be discussed later, it is improbable that new genes just spring up into existence and gene loss cannot be the ultimate cause of biodiversity. Furthermore, once an organism is dead, it is unable to evolve into a different organism, new or old. A dead organism has but one fate: decay.
Note that the exact number of genes that belong to a specific group in an organism may change with the discovery of more genes in other currently uncharacterized organisms. However, it is unlikely that the new discoveries will alter the conclusion that most bacteria essential genes do not have eukaryotic homologs and that the vast majority of the eukaryotic essential genes are unique to the eukaryotic domain. This is due to the fact that the pattern of taxonomic distribution of the essential genes is very similar to that of all the genes experimentally tested (fig. 3), or all the genes encoded in the genomes (fig. 4).
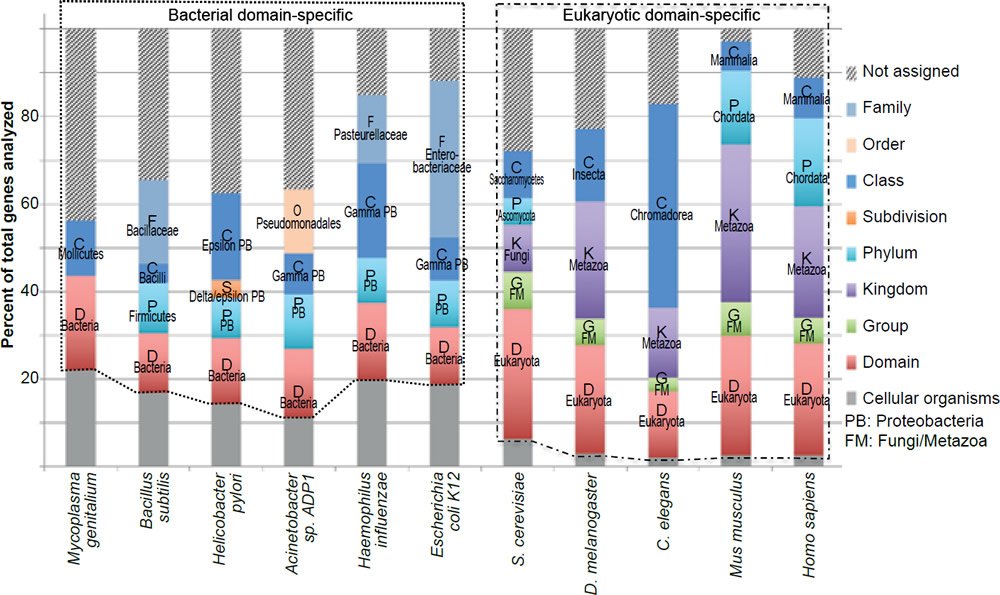
Fig. 3. Taxonomical distributions of all the genes tested for essentiality of the organisms analyzed in Fig. 1.
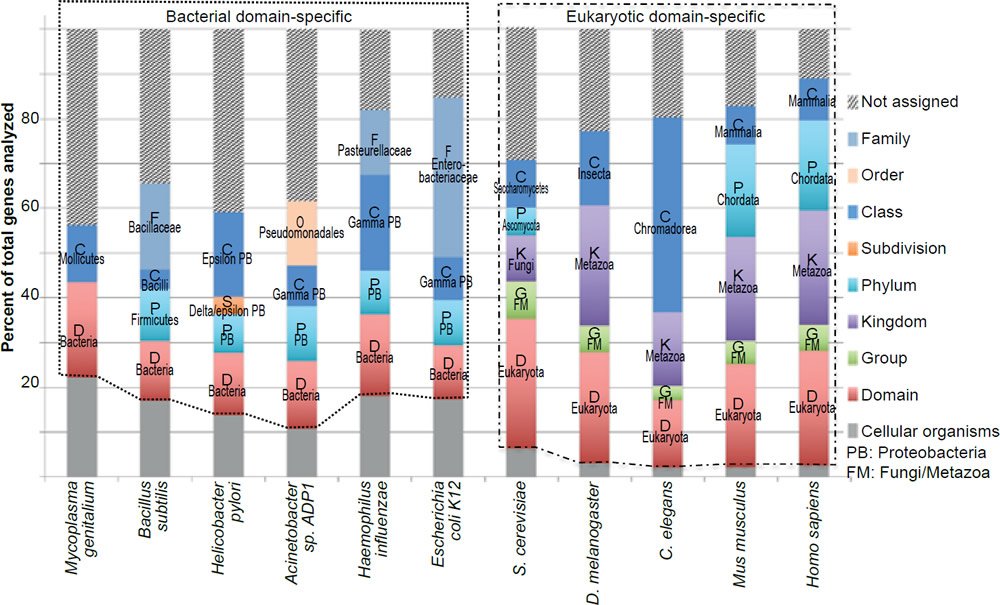
Fig. 4. Taxonomical distributions of all the genes encoded in the genomes of the organisms analyzed in Fig. 1.
Consistently, E. coli TREGs restricted to the bacterial domain, or the proteobacteria phylum, or the gammaproteobacteria class, or the enterobacteriaceae family, have been identified via two independent methods, though not all TREGs identified are identical (fig. 5 [left] and table 3) (Baba et al. 2006; Chen et al. 2012a; Gerdes et al. 2003). One of the studies used single-gene deletion (Baba et al. 2006), the other used transposable element to disrupt gene function (Chen et al. 2012a; Gerdes et al. 2003). The latter is the source of the OGEE dataset used for E. coli in Fig. 1.
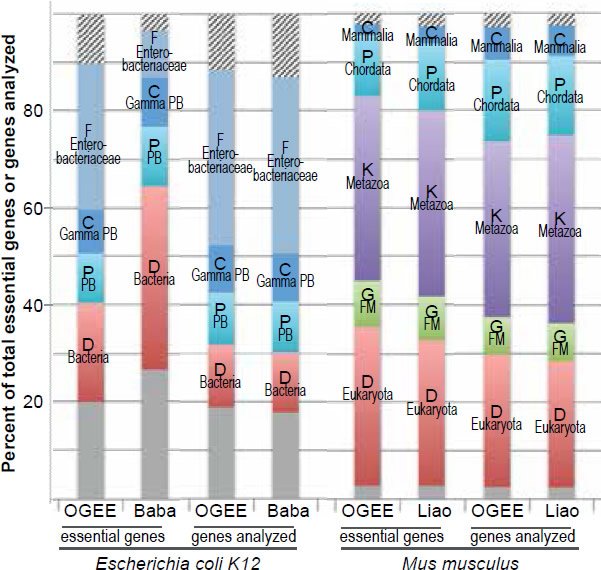
Fig. 5. Comparisons of essential genes identified in different experiments in E. coli (left) or in Mus musculus (right). The two experiments for E. coli use different methods to disrupt the functions of genes, the OGEE via transposable elements while the Baba via gene deletion. The two experiments for mice are both via knockout. OGEE: http://ogeedb.embl.de, Baba: (Baba et al. 2006), Liao: (Liao and Zhang 2007).
| Essential in Baba | Not essential in Baba | Analyzed in OGEE but not in Baba | Not found in Baba | Total in OGEE | |
|---|---|---|---|---|---|
| Essential in OGEE | 205 | 303 | 18 | 12 | 628 |
| Not essential in OGEE | 49 | 2939 | 87 | 152 | 3227 |
| Analyzed in Baba but not in OGEE | 46 | 576 | |||
| Not found in OGEE | 4 | 192 | |||
| Total in Baba | 304 | 4100 |
Similarly, mouse TREGs restricted at different taxonomic ranks have been identified in two largescale gene knockout studies, though not all TREGs identified are identical (fig. 5 [right] and table 4) (Chen et al. 2012a; Liao and Zhang 2007). Therefore, we can safely conclude that bacteria and eukaryotes belong to separate family trees.
| Essential in Liao | Not essential in Liao | Analyzed in OGEE but not in Liao | Total in OGEE | |
|---|---|---|---|---|
| Essential in OGEE | 1621 | 130 | 867 | 2618 |
| Not essential in OGEE | 421 | 1540 | 1459 | 3420 |
| Analyzed in Liao but not in OGEE | 68 | 35 | ||
| Total in Liao | 2110 | 1705 |
Third, different bacteria have different TREGs, suggesting that not all bacteria can be connected by a single family tree. Of the six bacteria analyzed, M. genitalium and Bacillus subtilis belong to the phylum of Firmicutes, with the former a member of the Molicutes class and the latter the Bacilli class. M. genitalium and B. subtilis are separated from each other by their class-restricted TREGs, and together they are separated by phylum-restricted TREGs from the other four analyzed bacteria, which belong to the phylum of Proteobacteria. Of these four, Helicobacter pylori is a member of the Epsilonproteobacteria class. Haemophilus influenza (order: Pasteurellales, family: Pasteurellaceae), Acinetobacter (order: Pseudomonadales, family: Moraxellaceae), E. coli (order: Enterobacteriales, family: Enterobacteriaceae) are members of the Gammaproteobacteria class, within different orders and families. These four bacteria are separated from each other by class, or order, or family-restricted TREGs. Therefore, the six bacteria analyzed belong to six different family trees.
Fourth, different eukaryotes have different TREGs, suggesting that not all eukaryotes can be connected by a single family tree. Of the five eukaryotes analyzed, only Mus musculus and Homo sapiens belong to the same class (Mammalia). These two organisms are separated from the other three organisms, S. cerevisiae, Drosophila melanogaster, Caenorhabditis elegans, which are separated from each other by their class-restricted essential genes. Thus, these five eukaryotes belong to at least four different family trees.
Do mice (M. musculus) and humans (H. sapiens) belong to one family tree or two family trees? The data analyzed in the OGEE database do not provide a definitive answer. Therefore, I performed additional studies to resolve the issue. Demuth and colleagues reported 870 primate protein families (with 689 human unique genes) that do not have homologs in rodents and 1773 rodent protein families that do not have homologs in primates (Demuth et al. 2006). Unfortunately, the identities of the genes cannot be retrieved due to the Ensembl protein family name changes and the authors’ lack of a record of those genes (Matthew W. Hahn, personal communication). Thus, whether any of those genes are TREGs will remain unknown. In a more recent study, Zhang and colleagues reported that 1828 human genes are primate specific (389 unique to humans) and 3111 mouse genes are rodent specific (1452 unique to mice) (Zhang et al. 2010). Eleven of the primate specific genes on their list are reported as essential in the OGEE database. A BLASTp search performed on 10/6/2015 in the NCBI nonredundant gene database confirmed that three of the 11 (ENSG00000143226, ENSG00000170848, ENSG00000179750) are primate specific. Two of the 11 are unique to humans according to Zhang and colleagues: ENSG00000182242, a testis specific protein that used to be called expressed 28 pseudogene 1 and is no longer listed as a gene in Ensembl, and ENSG00000185829, which encodes ADP-ribosylation factor-like 17A. A BLASTp search in the NCBI non-redundant gene database shows that neither is unique to human, nor to primates. Of the 3111 rodent specific genes reported by (Zhang et al. 2010), 14 (of which four belong to the mouse-specific group) were identified as essential by OGEE or by Liao et al. (http://ogeedb.embl.de/ and [Liao and Zhang 2007). None of these are restricted in rodents based on the NCBI non-redundant gene database. A main reason for the failure of the reports on human or mouse specific genes in the Zhang study to remain true is that they only chose a few organisms for their study instead of using all the data available in the NCBI database (Zhang et al. 2010). More importantly, the list of human or mouse essential genes is far from complete. Only 6141 of mouse genes (26.6% of the 23,041 encoded) have been analyzed by gene knockout, while the essentiality of human genes was estimated from knockdown experiments in cell lines, not inside real human bodies in which a living cancer cell can lead to termination of its carrier (http://ogeedb.embl.de/ and [Liao and Zhang 2007]). Therefore, a thorough comparison of all of the human and mouse genes against genes of more organisms and a comprehensive investigation of the essentiality of the human and mouse genes are warranted. Nonetheless, the three primate-specific essential genes in the human genome suggest that mice and humans belong to two separate family trees. A conclusion confirmed by their taxonomically-restricted essential non-coding DNA sequences as described in the next section (Pikaard 2002; Tan and Tomkins 2015b).
D. Taxonomically-restricted Essential Non-coding DNA Sequences
In addition to genes, i.e. DNA sequences that code for proteins or RNAs as end products, all genomes contain non-coding DNA elements, including origins of replication that are required for DNA replication, enhancers and promoters that are necessary to determine when and where and how much a gene will be transcribed, introns (for eukaryotes), and sequences critical for maintaining the structure or stability of chromosomes or for chromosome segregation during cell division.
Many experiments have shown that prokaryotes and eukaryotes differ in their origin of DNA replication and gene regulatory sequences, including enhancers and promoters (Tan and Tomkins 2015b). Differences of regulatory sequences of ribosomal RNA genes in mice and humans render human cells unable to transcribe mouse ribosomal RNA genes, and vice versa (Pikaard 2002). Therefore, mouse protein producing machinery can only be generated in mice and human protein producing machinery can only be generated in humans. This incompatibility in the ribosomal biogenesis, a process vital for gene translation and survival of any organism, makes it impossible for mice and humans to share a common ancestor.
So far, a genome-wide, experimentally-tested, functional annotation of non-coding DNA sequences has only been reported for the alphaproteobacteria Caulobacter crescentus (Christen et al. 2011). Consistent with the above conclusion about TREGs, 27% (129) of the 469 essential genes of C. crescentus (phylum: proteobacteria, class: alphaproteobacteria, order: caulobacterales) do not have homologs in E. coli and 46% (235) of the 512 essential genes of E. coli do not have homologs in C. crescentus (Christen et al. 2011), suggesting that C. crescentus and E. coli do not share a common ancestor. In addition, C. crescentus could not have shared a common ancestor with the other five bacteria analyzed in Fig. 1 due to their class restricted TREGs. Strikingly, of the 1012 essential DNA segments identified, the majority do not code for proteins. These non-coding DNAs include 402 regulatory sequences and 130 other non-coding elements. It is highly possible that other organisms also contain a large quantity of essential non-coding DNA sequences, as in Caulobacter. Knowledge of how organisms differ in their essential non-coding DNAs will be very useful in determining the origins and relationships of different life forms.
E. Gene Gain
Next I will address the question of whether two organisms with different TREGs belong to the same family tree by integrating results of experiments investigating, intentionally or unintentionally, where or how the TRGs arose or whether a TRG can be easily generated via mutation and selection. Keep in mind that, going back through the hypothetical evolutionary history, every gene was once a TRG and similar to no other genes. Therefore, to answer the question of the origin of TRGs is like to answer the question of the origin of life itself.
A variety of evolutionary mechanisms have been proposed to account for the emergence of new genes (Long et al. 2003):
- Gene duplication followed by mutations and subfunctionalization or neofunctionalization;
- Exon shuffling: combination of exons from different genes;
- Retroposition: a new gene copy is created at a new genomic position;
- Mobile element activity: part of a transposable element is incorporated into a gene;
- Gene fusion/fission: two genes fuse into one or one gene splits into two;
- Lateral gene transfer: horizontal, instead of vertical, transmission of genes;
- De novo origination: a coding gene derived from non-coding DNA.
Of all the proposed mechanisms, only the de novo origination can generate a totally new gene that does not have homology to any other genes. The results of all others will be a homolog of the source gene(s).
Note that all these mechanisms are inferred from sequence comparison and have little empirical support. The assumption, normally unstated, is that we know the real family tree or the phylogeny of the life-forms and genes under consideration. The reality is that nobody has seen how a gene has come to be and that there are no labels on any organism or its coding genes telling people its parent(s). Furthermore, nobody is able to go back in time to investigate the issue. Of course, one can wish and claim that a noncoding DNA segment is on the way to becoming a gene, but such claims do not validate much unless he/she is able to prove that this non-coding DNA segment is not degeneration of a gene that used to be. In addition, it is more likely that this DNA segment has never been and will never be a gene—it just serves as a regulatory or structural sequence.
Is it possible that a new organism is born all together with all its organism-specific essential genes, which somehow derive from DNA segments that do not code for any genes in its parent(s)?
Though most people are satisfied with the idea that new genes or proteins somehow pop up in the history of life, and many claim gene gain, sometimes in the number of hundreds or thousands of genes at a time, based on mere sequence comparison and hypothetical pedigrees, e.g. (Demuth et al. 2006), some researchers made the painstaking efforts to experimentally test the possibility of generating new genes by accumulated mutation and selection. Some of them used the forward approach, while others the reverse approach. The former performed long-term culturing of different organisms—mutation accumulation experiments— and analyzed mutations accumulated. The latter artificially engineered mutations into known genes and estimated the possibility of finding a functional protein out of all the possible arrangements of the composing amino acids. I will examine the forward and reverse approaches in the next two subsections.
E.1 Spontaneous Mutations
Generally, all the amino acid differences between two homologous proteins in two organisms are interpreted being generated by mutation with the allegedly less complicated organism representing the ancestor state and with the normally unstated presupposition that we know the pedigree/history of the compared organisms. In reality we barely know the deep-time history of any organism, so, it is formally possible that some of the differences were just standing genetic variation. For example, for sexually reproducing organisms, a two-egged twin may inherent two non-overlapping halves of the genomes of their parents. They would have many differences in their genomes and would appear that they have had experienced a long time of diverging at their birth.
To avoid the ambiguity of mutation designation based on hypothetic pedigrees, some try to investigate the power of naturally occurring mutations in the whole organism by culturing inbred lines at conditions of minimum selection so mutations can be accumulated and are allowed to drift to fixation. Such mutation accumulation experiments have been done in several organisms, including S. cerevisiae, D. melanogaster, C. elegans, Chlamydomonas reinhardtii, and Arabidopsis thaliana (Aquadro et al. 1990; Avila et al. 2006; Azevedo et al. 2002; Baer et al. 2005; Barrick et al. 2014; Bégin and Schoen 2006; Brito et al. 2010; Burch et al. 2007; Chavarrías, López-Fanjul, and García-Dorado 2001; Chen et al. 2012b; Chen and Zhang 2014; Clark, Wang, and Hulleberg 1995; Cooper 2014; Cooper, Bennett, and Lenski 2001; Cooper and Lenski 2000; Davidson, White, and Surette 2008; Deng, Li, and Li 1999; Denver et al. 2009; Denver et al. 2010; Denver et al. 2012; Domingo-Calap, Cuevas, and Sanjuán 2009; Downie 2003; Engström, Liljedahl, and Björklund 1992; Estes, Phillips, and Denver 2011; Fry 2004; Fry et al., 1999; García-Dorado and Caballero 2002; García-Dorado and Gallego 2003; Good and Desai 2015; Gray and Goddard 2012; Haag-Liautard et al. 2007; Hall et al. 2008, 2013; Heilbron et al. 2014; Houle and Nuzhdin 2004; Joseph and Hall 2004; Katju et al. 2015; Kavanaugh and Shaw 2005; Keightley and Caballero 1997; Keightley and Lynch 2003; Keightley et al. 2009; Kuzdzal-Fick et al. 2011; Lee and Marx 2012; Loewe, Textor, and Scherer 2003; Long et al. 2013; Lynch et al. 2008; Maklakov 2013; Maside, Assimacopoulos, and Charlesworth 2000; Matsuba et al. 2012; McGuigan, Petfield, and Blows 2011; Ness et al. 2012; Nishant et al. 2010; Ossowski et al. 2010; Pannebakker et al. 2008; Papaceit et al. 2007; Roles and Conner 2008; Rutter et al. 2012; Salgado et al. 2005; Saxer et al. 2012; Schrider et al. 2013; Schultz and Scofield 2009; Shabalina, Yampolsky, and Kondrashov 1997; Sousa et al. 2013; Sung et al. 2012a; Trindade, Perfeito, and Gordo 2010; Vassilieva, Hook, and Lynch 2000; Yampolsky et al. 2005; Zhu et al. 2014).
These mutation accumulation experiment studies show that the vast majority of the mutations decrease the fitness of the organisms (Domingo-Calap, Cuevas, and Sanjuán 2009; Heilbron et al. 2014; Katju et al. 2015; Leiby and Marx 2014; Mallet, Kimber, and Chippindale 2012; Morgan et al. 2014; Sharp and Agrawal 2013; Trindade, Perfeito, and Gordo 2010; Vassilieva, Hook, and Lynch 2000), especially in small size populations (Katju et al. 2015), not only the mutations located within protein coding regions but also those within the intergenic regions (Heilbron et al. 2014). In addition, the mutations that enhance the fitness of organisms in one growth condition tend to render them less competitive in other conditions (Cooper and Lenski 2000; Leiby and Marx 2014; Rutter et al. 2012). Furthermore, some recent studies suggest that many natural mutations are not random after all, but context dependent (Lee et al. 2012; Sung et al. 2015).
Table 5 lists mutations that have been identified in some of the mutation accumulation experiments where the genetic mutations have been determined by sequencing. Some mutations are located within genes and some in the intergenic regions. For those point mutations located within genes, the ones causing amino acid changes are called nonsynonymous mutations, while those not causing amino acid changes are called synonymous mutations.
| Organisms | Genome size | Number of generation | Small-sized mutations | Large-sized mutations | References | ||||||
|---|---|---|---|---|---|---|---|---|---|---|---|
| Single base replacementa | insertion/deletionc | complexd | duplicationc | insertion/deletionc | inversion | ||||||
| base substitution rateb | number | G/C to A/T biased? | |||||||||
| Eukaryotes | |||||||||||
| Arabidopsis thaliana | 125Mb | 30 | 7.00E-09 | 99 (4/11) | y | 17 (1-15) | 2 (610, 5445) | Ossowski et al. 2010 | |||
| Armillaria gallica | 100Mb | 12 (0/4) | n | 1 (400) | Anderson and Catona 2014 | ||||||
| Caenorhabditis briggsae | 100MB | 250 | 1.23 E-09/1.44 E-09e) | 91+150 (6+12/14+23) | y | Denver et al. 2012 | |||||
| Caenorhabditis elegans | 100Mb | 250 | 1.33 E-09/1.62 E-09e | 108+99 (13+16/28+34) | y | Denver et al. 2012 | |||||
| NA | 2.7 E-09 | 391 (24/56) | y | Denver et al. 2009 | |||||||
| C. elegans N2 and LSJ1f | 100Mb | 877 (21/49) | 311 (1-9) | Weber et al. 2012 | |||||||
| Chlamydomonas reinhardtii | 121Mb | 350 | 2.08E-10 | 9 (2/2) | y | 5 (1-3) | Ness et al. 2012 | ||||
| 1730 | 6.76 E-11 | 20 (0/1) | y | 13 (1-12) | Sung et al. 2012a | ||||||
| Daphnia pulex (mitochondrion), asexual MA lines | 116/81f | 4.3 E-08 | 3 (1/0) | n | 8 (1-2) | Xu et al. 2012 | |||||
| Daphnia pulex (mitochondrion), sexual MA lines | 61 | 2.8 E-08 | 3 (0/3) | y | 9 (1-2) | Xu et al. 2012 | |||||
| Drosophila melanogaster | 175Mb | 262 | 3.5 E-09 | 174 (8/18) | y | 7 (1-4) | Keightley et al. 2009 | ||||
| 1 | 2.8 E-09 | 6 | 3 (4-13) | Keithley et al. 2014 | |||||||
| 145-149h | 5.5 E-09h | 732 | y | 60 (1-26) | 7 | 7 (939-4285) | 22 (26-2642) | Schrider et al. 2013 | |||
| D. melanogaster (mitochondrion) | 200 | 6.20 E-08 | 28 (1/23) | y | 8 (1-3) | Haag-Liautard et al. 2008 | |||||
| Mesoplasma florum | 0.79Mb | 2351 | 9.78 E-09 | 527 (70/417) | y | 101 (1-11) | Sung et al. 2012a | ||||
| Paramecium tetraurelia | 72Mb | 3300 | 1.94 E-11 | 29 (8/15) | y | 5 | Sung et al. 2012b | ||||
| Saccharomyces cervisiae | 12.05Mb | 4800 | 3.3 E-10 | 33 (6/18) | y | 2 (1-3) | 11 (74270-541056 | 4 (6076-601163) | Lynch et al. 2008 | ||
| S. cerevisiae (mitochondrion) | 4800 | 1.3 E-8 | 13 | n | 30 (1-6) | Lynch et al. 2008 | |||||
| Bacteria | |||||||||||
| Bacillus subtilis | 4.15Mb | 5080 | 3.28 E-08 | 350 (60/202) | Sung et al. 2015 | ||||||
| B. subtilis mutS-i | 4.15Mb | 2000 | 3.31 E-8 | 5295 (1489/3247) | n | Sung et al. 2015 | |||||
| Escherichia coli K12 | 4.64Mb | 3080/6356j | 1.88 E-10/2.45 E-10 | 93/140 (55/124) | y | 9/12 (1-4) | Lee et al. 2012 | ||||
| 6356k | 154 | 19 (1-4) | 3 (350) | 49 (350) | 1 (1829) | Barrick et al. 2014 | |||||
| E. coli K12, MutL-l | 4.64Mb | 375 | 3.26 E-8 | 1625 (482/930) | n | 306 (1-4) | Lee et al. 2012 | ||||
| Mycobacterium tuberculosis | 4.0Mb | NA | 2.01-3.03 E-10 | 24 | y | Ford et al. 2011 | |||||
| Pseudomonoas aeruginosa PAO1ΔmutSl | 6.26MB | 644 | 2.95 E-8 | 788 (202/495) | y | 164 (<10) | 1 | 1 (1880) | Heilbron et al. 2014 | ||
| Salmolella typhimurium | 4.95MB | 5000 | 943 (230/566) | y | Lind and Anderson 2008 | ||||||
| Phage | |||||||||||
| bacteriophage PhiZX174 | 5.4kb | 1.0 E-06 | 7 (0/7) | n | Cuevas, Duffy, and Sanjuan 2009 | ||||||
| DNA and RNA bacteriophages | 3.6-6.4kb | 303 (89/202) | n | Domingo-Calap, Cuevas, and Sanjuan 2009 | |||||||
| phage Qβ | 9.1 E-6 | 41 (9/32) | n | 4 (1) | Garcia-Villada and Drake, 2012 | ||||||
| Population genomics | |||||||||||
| Arabidopsis thaliana | 161-184Mbm | 4,540,000 | 600,000 | Long et al. 2013 | |||||||
| Drosophila melanogaster | 169.7-192.8Mb | 4,853,802 | 1,296,080 | Huang et al. 2014 | |||||||
| Homo sapiens | 3300Mb | 5,907,699 (60,157/69/434)o | 650,000 (1-50) | 14,000 | Abecasis et al. 2010 | ||||||
| 9,243,994 | 17,601 | Schuster et al. 2010 | |||||||||
| Apis mellifera | 236Mb | 8,282,459 | Wallberg et al. 2014 | ||||||||
| 12,041,303 | Harpur et al. 2014 | ||||||||||
No birth of novel genes has been found to result from these accumulated mutations; most experimentally-identified spontaneous mutations are single base substitutions and small (<13 base pairs) indels (deletions/insertions) (table 5, also see [Wei et al. 2014] and references wherein). In contrast, a common phenomenon that emerges from the multiple mutation accumulation experiments is that genes that are not used tend to degenerate—mutate to a non-functional gene, or get lost—be deleted totally (Cooper and Lenski 2000; Lee and Marx 2012; Leiby and Marx 2014; Raeside et al. 2014; Rau et al. 2012). This conclusion is confirmed by studies of genomic changes of symbiotic organisms (Lee and Marx 2012; Rau et al. 2012) and the unintended mutation accumulation in the balancer chromosomes of Drosophila (Araye and Sawamura 2013).
The most celebrated gain of novel function mutation discovered from the famous Lenski long-term E. coli evolution experiment is the acquired ability of E. coli, which uses citrate as carbon source only in anaerobic conditions, to use citrate as carbon source at aerobic atmosphere (Blount et al. 2008). A detailed analysis showed that the reason the mutant E. coli is able to use the citrate in the aerobic environment is not due to a gain of new genes but is caused by a tandem duplication. The resultant duplicated citrate transporter is positioned next to an aerobically expressed promoter, leading to the citrate transporter that normally is only expressed in the absence of oxygen being ectopically expressed in the presence of oxygen (Blount et al. 2012). Such misregulations of gene expression have been reported previously with the consequence of cancer formation, e.g. ectopic expression of Wnt1 gene caused by mouse mammary tumor virus integrations (Nusse 2005; Tekmal and Keshava 1997).
The fate of unused genes from both the mutation accumulation experiments of various organisms in artificial laboratorial environments and from the symbiotic organisms in natural hosts demonstrate that it is highly unlikely, if not totally impossible, for an organism-specific gene to arise naturally. This is because before the organism-specific novel gene—a gene without homologs—could come to be, it would be a useless stretch of DNA, a burden for the organism carrying it, and would likely be deleted as an organism normally does to an unused gene. In fact, all the alleged births of new genes are based on sequence comparison of an organism with its theoretical or hypothetical ancestral organism (Demuth et al. 2006; Kaessmann 2010; Long et al. 2003; Tautz and Domazet-Lošo 2011).
E.2 Engineered Mutations
Instead of waiting for spontaneous mutations, another group of researchers use the reverse approach to determine the frequency of finding a functional protein enzyme in the possible sequence space (Axe 2004; Gauger et al. 2010; Reidharr-Olson and Sauer 1990; Taylor et al. 2001). They found that to make a polypeptide, i.e. linking amino acids together with peptide bonds is one thing, while it is totally another thing to make a functional polypeptide—a protein enzyme—that folds like a natural protein and catalyzes a chemical reaction like a natural enzyme in the cell, albeit with less efficiency.
For a 153 amino acid long ß-lactamase domain, a typical protein domain with α helixes, ß sheets, and loops, the possibility of finding a polypeptide that functions is one in 1077 (Axe 2004). The human genome contains 23,000~30,000 protein coding genes, with a median length of 375 amino acids (Brocchieri and Karlin 2005; Wijaya et al. 2013). If we scale according to the length of the protein, the possibility of a 375 amino acid long polypeptide functions as a natural protein is one in 10189 (= 1077 (375/153)). To put this number in perspective, the estimated total mass of the visible universe is 1080 hydrogen atoms ([Davies 2006] and http://en.wikipedia.org/wiki/Observable_universe). The maximum number of events that could have happened since the birth of the universe are approximately 10140, assuming the universe started at the big bang 14.6 billion years (1017 seconds) ago:
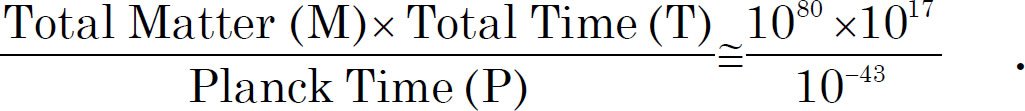
T: the longest estimated history of the universe, P: The shortest time in which any physical effect can occur (10-43 seconds) (Meyer 2009).
Starting with a shorter and structurally simpler enzyme, the 93 amino acids long chorismate mutase (CM), which has three α helixes connected with two short loops, Taylor and his colleagues gave a more optimistic estimate (Taylor et al. 2001): one in 1024 polypeptides that have the same hydropathic pattern of the natural CM would have some enzymatic activities. Accordingly, for an average human protein of 375 amino acids having the desired hydrophobicity, one in 1097 (=1024 (375/93)) may function as the native protein. To account for the foldability based on hydropathic constraints alone (maximum: one in 1010) (Lau and Dill 1990) and the percentage of correctly folded polypeptides to perform a particular function (assuming one in 103) (Axe 2004), that number becomes 10110, i.e. 1030 less likely than finding a specific hydrogen atom in the whole visible universe, assuming all the mass in the universe were made of hydrogen.
A more shocking observation of Taylor and colleagues (Taylor et al. 2001) is that two beneficial and functional mutations often cancel each other’s effects. Briefly, they generated and screened two libraries of CM mutants, library one (lib1) partially randomized helix H1 and library two (lib2) partially randomized H2 and H3 of the three α helixes of CM. They found ~99.99% of their mutants were not functional, i.e. only one in 10-4 maintained some enzymatic function. The big surprise arose when they combined those functional mutants from lib1 and lib2. The vast majority (~99.99%) of the combinations did not function at all as a CM. Thus, instead of increases, the second mutation normally counteracts the beneficial effect introduced by the first mutation, though the second mutation is functional by itself. Furthermore, the chance of finding a functional mutant is not increased with the knowledge of the functionality of the individual mutations. Such phenomenon is later termed “sign epistasis,” a fancy way of stating that two beneficial mutations work against each other (Schenk et al. 2013; Weinreich et al. 2006).
In other words, a mutation is much more likely to disrupt than to improve the function of a protein. For each constructive path to a functional protein, there are many disruptive sidetracks. These sidetracks may prevent the cells from taking a constructive path, however beneficial it might be theoretically. This is experimentally demonstrated by Gauger and colleagues (Gauger et al. 2010).
E.3 Route Possible and Route Actual
To determine what an organism would naturally do when given the choice of a potential long-term beneficial path that is a short-term burden, a scenario very similar to making a new gene from a no-gene, Gauger and colleagues directly analyzed the likelihood of E. coli taking a two-step, theoretically highly beneficial path—restoring function to a nonfunctional trpA gene with two point mutations (Gauger et al. 2010). One of the two, trpAE49V, is a complete loss of function mutation, while the other, trpAD60N, a partial loss of function mutation. Both mutations, individually, revert readily to functional trpA+ (three to seven revertants from an overnight culture of about 109 colony-forming units). They combined the two mutations and overexpressed the double mutant in E. coli whose endogenous trpA gene was deleted. They screened for revertants of the double mutation under three tryptophan-limiting conditions: in liquid cultures, in solid cultures, as well as in a mutator strain that increased the reversion rate of the trpAE49V and trpAD60N five-fold and twenty-fold, respectively. No double mutants reverted to full Trp+ phenotype, although some serial cultures have been propagated for 9300 generations. They also routinely plated batch and serial cultures of the mutant strains to tryptophan-free agar to look for the presence of weak Trp+ revertants and found one weak Trp+ colony this way. This mutant had the trpAD60N genotype. Unfortunately, this revertant failed to compete with its coevolving siblings to survive and propagate to become fixed in the population, thus, failed to generate a full Trp+ phenotype. The failure for the double mutants to revert is not due to the inability of the long-term cultures to adapt; their growth rate doubled within 500 generations. The failure resulted from sidetracking, including deletion of the non-functional TrpA gene and expression-reducing insertions, point mutations, and rearrangements.
Four conclusions can be drawn from the experiments on mutation and natural selection: 1) Out of all the possible sequences of amino acids in a polypeptide, only a tiny fraction can function as proteins—1 in 1077 for a 153 amino acid long polypeptide (Axe 2004); 2) Most spontaneous mutations are small and deleterious; 3) A gene not used tends to be lost; 4) A long-term beneficial path can be easily sidetracked by short-term metabolic cost cuts. Thus, it is highly unlikely, if not totally impossible, to generate a novel protein by accumulated mutation and natural selection.
F. Gene Loss
The above discussion makes natural gene gain highly improbable, even if theoretically possible. Next, I will discuss the opposite, gene loss, regarding the possibility that the organism B specific essential genes were in its ancestor organism A but were lost because they were not required for the survival of the ancestor.
Indeed, as mentioned above, a gene that is not used tends to degenerate or be totally deleted. However, gene loss cannot be the ultimate cause of the diverse life forms on earth for two reasons. First, all the mutations studied with model organisms, including virus, bacteria, yeast, worms, flies, and mice, have only made them abnormal or dead or have no observable phenotypes; the mutations have not changed one species into another. Second, gene loss as a mechanism to generate biodiversity requires the ancestors to be more complicated and contain more genes than the extant organisms. This will only create an even bigger question of how or where those ancestors came from.
For instance, considering six simple hypothetical organisms (fig. 6), when only organisms A and B (each contains four genes) are analyzed and the rest are unknown or not analyzed, genes X2, X3, X4, and X6 would be identified as organism specific. Suppose that X2 and X3 are essential genes, while X4 and X6 are not. Because A and B each contains its own organism specific essential gene, they could not evolve from each other. However, they could share a common ancestor that contains genes X2, X3, X4, and X6. Note that even though both A and B could be generated by gene loss from their common ancestor (CA), it is unlikely either A or B could become the CA because it requires gene gain. In other words, CA has to be the parent but not a transitional intermediate. Furthermore, genes X2 and X3 would perform a redundant function in the ancestor; they would be synthetic lethal for the ancestor. Therefore, loss of function of either gene X2 or X3 may have no visible phenotype in the ancestor but loss of both would be lethal. With the discovery of organisms C to E, we will find that an organism has to have either X2 or X3 or both (fig. 6C to E). On the other hand genes X4 and X6 may be involved in functions that do not threaten the survival of their carrier organisms in the experimental conditions, although may do so in other conditions.
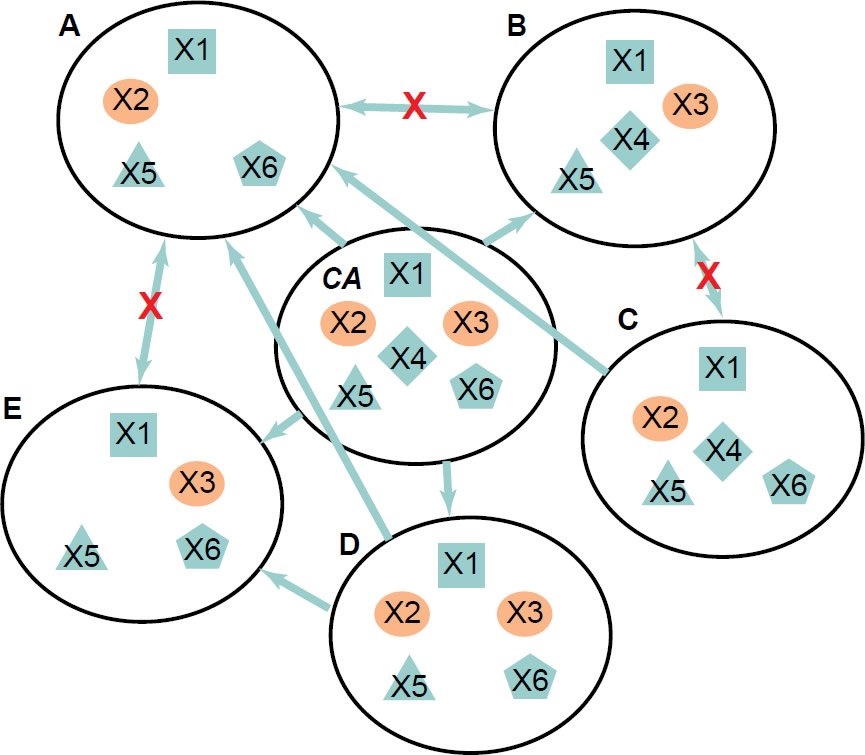
Fig. 6. A hypothetical group of six organisms. X1 through X6 represent genes. X2 and X3 are essential genes for organisms A, B, C, and E but not for organisms D and CA. X2 and X3 are synthetic lethal for organisms D and CA. Potential ancestor-offspring pairs are linked with arrows pointing from ancestors to offspring. Red Xs indicate that it is impossible for A and B, or A and E, or B and C to evolve from each other.
Yeast strains that have either one of two genes that are synthetic lethal deleted have been generated in laboratories, though the resultant strains remain being yeast, instead of becoming a new species (Ooi et al. 2006; Zinovyev et al. 2013). It is formally possible that such mutations occur naturally. Only comparison of the genome sequences of various individuals within a species could allow us to know whether such complementary gene loss occur naturally, and if so, the frequency of the occurrence.
G. A Potential Problem and Possible Solutions
If indeed complementary gene loss does occur naturally, would this negate the above argument on using TREGs to determine whether two organisms can belong to the same family tree? I think this unlikely. However, it does raise an issue that we need to be cautioned about when using the TREGs to determine whether two organisms belong to the same family tree. The conclusion needs to be checked with the following three considerations.
First, the similarity of the shared genes and of noncoding DNA elements between the two organisms compared needs to be considered. The shared genes or non-coding DNA elements of two organisms of the same species with unequal essential gene lists, such as the engineered yeast strains that contain one or the other of a pair of synthetic lethal genes, should be identical or nearly identical. They should contain only small differences, such as single base changes, small indels, or rearrangement of segments, including inversions, translocations, or copy number variations. By copy number variations, I exclude the difference between zero copy and non-zero copy or copies. In addition, as shown in the hypothetical example of Fig. 6, sequencing of diverse members of the same species will likely reveal that each of these members has at least one of the two synthetic lethal genes.
Second, the scale is important. Since the mutation accumulation experiments show that most observed mutations are single base mutations or small indels, gene loss should be a rare event. The number of TREGs between organisms that belong to separate family trees should be much larger than the number of TREGs between organisms that belong to the same family tree. How much larger the difference should be needs to be determined by population genomics. Currently, genome sequences of most organisms are based on the sequences of a single individual or a single culture. Consequently, we do not know how many mutations a species can hold, or the extent of genetic diversity between individuals in the same species. To estimate the whole gene pool of a species, it is necessary to sequence multiple diverse individuals (for large animals or large plants) or populations (for micro-organisms). Several studies have sequenced the genomes of humans from different locations around the world (Abecasis et al. 2010, 2012; Ball et al. 2012; Rasmussen et al. 2011; Schuster et al. 2010). It will be interesting to have a detailed comparison of these human genomes to determine the extent of homozygous or heterozygous gene loss within the Homo sapiens species.
Finally, the knowledge of gene networks is important. Genes never work alone but function with other genes in signal transduction pathways and other elaborate regulatory networks. It is more likely that one gene or a small number of genes of a pathway be lost than all members of the whole pathway. Fig. 7 summarizes in a flowchart the steps to determine whether two organisms can belong to the same family tree.
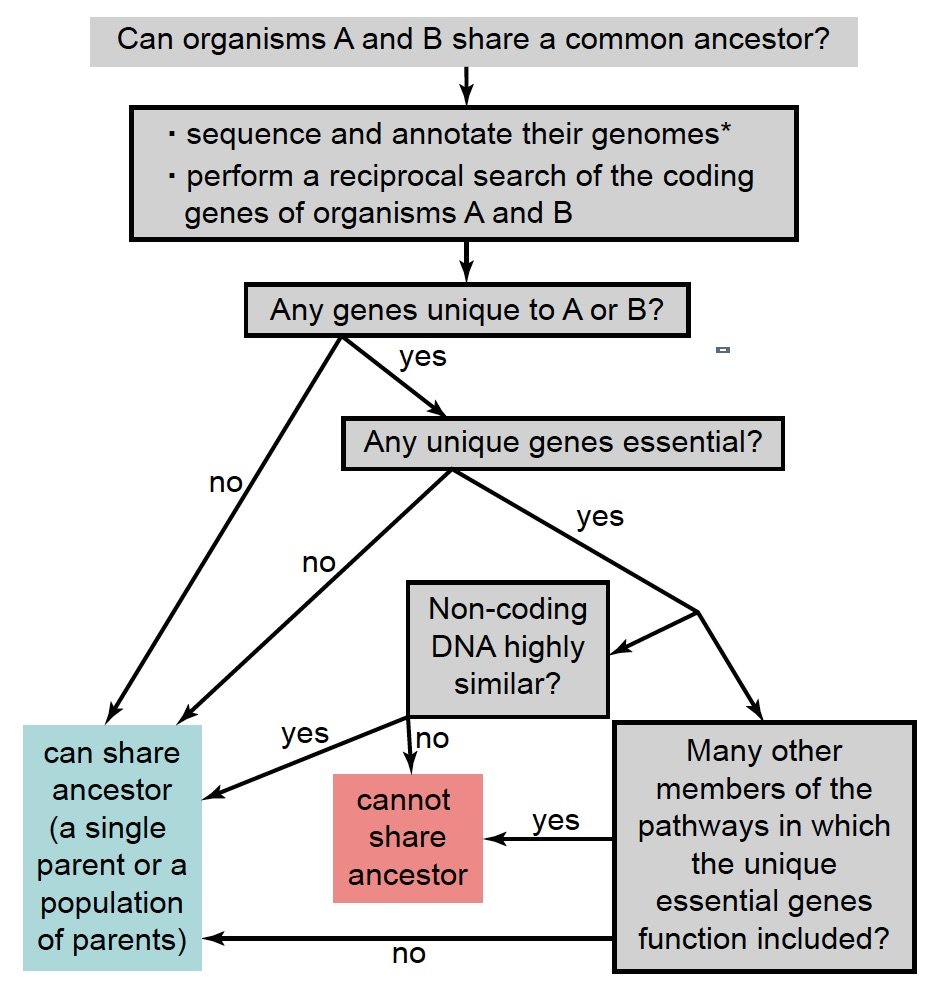
Fig. 7. A flowchart to determine whether two organisms can belong to the same family tree. *: For sexually reproducing organisms, the genomes of both sexes should be included.
Conclusions and Discussions
TREGs can be used as a means to determine whether two organisms can belong to the same family tree for two reasons. First, each TREG of an organism is necessary for the survival of that organism. Second, it is improbable for a new gene to be generated naturally, de novo, via accumulated mutation and selection. This is experimentally demonstrated by the failure of mutation accumulation experiments to generate any new genes, the extreme rarity of functional sequences of all the possible arrangements of the composing amino acids, the high possibility of a mutation to disrupt the function of a protein, the tendency of two beneficial mutations to work against each other, and the readiness of an organism’s choosing a route that provides short term metabolic cost cuts instead of a route that provides long term beneficial gains. The large number of TREGs in the diverse, though few, organisms analyzed in Figs. 1 and 2 indicate that no two of these organisms could have shared a common ancestor. This suggests that life on earth is represented by a forest of family trees, instead of one family tree.
The data shown in Figs. 1 and 2 are limited in several ways:
- Not many organisms are analyzed.
- Genes are not grouped in the same taxonomic ranks.
- Not all essential genes are known and/or analyzed for each organism.
- Data reliability has not been analyzed by an independent, second research group.
- Data are not updated with new findings.
To address these limitations, the following needs to be done:
- Analyze as many organisms as possible, starting from one member from each phylum, then expand to one member per order, then to one per family, then to one per genus.
- Group all genes from different organisms according to the same taxonomic ranks, including domain, phylum, class, order, family, genus, and species.
- Identify all essential genes for each organism, starting with model organisms and the species-specific genes, then to genus-specific, to family-specific, moving up the taxonomic rank.
- Cross-check the reliability of the data by different persons and different experimental approaches.
- Update with new findings.
In order to fully and reliably determine how all life forms are related to each other, we need to do the following:
- Sequence and annotate at least one genome in each phylum, class, order, or family.
- Identify TRGs and taxonomically restricted noncoding DNA sequences.
- Determine whether the TRGs and the taxonomically restricted non-coding DNA sequences are necessary for the viability or propagation of their carrier organisms.
- Continue to experimentally investigate the power of mutation.
- Cross-check the accuracy of the sequences and annotations of genomes and other data and data analyses.
Currently, the bottleneck is not obtaining genome sequences but their analyses, especially with regard to the differences between organisms. Furthermore, the limited analyses available were mostly done with the presumption of all organisms being linked via a big phylogenetic tree, an idea that I have argued against above and that has also been challenged by many others (Bapteste et al. 2013; Criswell 2009; Jeanson 2013; Koonin 2007; Koonin, Puigbò, and Wolf 2011; Koonin and Wolf 2009; Koonin, Wolf, and Puigbò 2009; Puigbò, Wolf, and Koonin 2009, 2012, 2013; Suárez-Diaz and Anaya-Muñoz 2008; Tan and Tomkins 2015a, b; Tomkins 2013; Tomkins and Bergman 2013). Thus, data analyses with the idea of a forest of family trees will be not only informative but also necessary and will be fruitful.
The emergent need is to build an information processing pipeline that is based on the framework of a forest of family trees, or an orchard of life (Frair 2000; Tomkins and Bergman 2013; Wise 1990; Wood 2006; Wood et al. 2003). The pipeline should streamline retrieving of sequence data, integrating multiple sequence datasets and phenotypic analyses datasets. It should distinguish functions inferred from mere sequence alignments and those from real wet experiments. Ideally, the pipeline will allow automatic updating yet with proper quality control.
Though the work is demanding, both in labor and in funds, it is exciting and rewarding. At the end, we will find the work worthwhile because it will help everybody to find a truly scientifically satisfactory answer to the fundamental question of life and the origin of life.
References
Abecasis, G. R., D. Altshuler, A. Auton, L. D. Brooks, R. M. Durbin, R. A. Gibbs, M. E. Hurles, and G. A. McVean. 2010. “A Map of Human Genome Variation from Population-Scale Sequencing.” Nature 467 (7319): 1061–73.
Abecasis, G. R., A. Auton, L. D. Brooks, M. A. DePristo, R. M. Durbin, R. E. Handsaker, H. M. Kang, G. T. Marth, and G. A. McVean. 2012. “An Integrated Map of Genetic Variation from 1,092 Human Genomes.” Nature 491 (7433): 56–65.
Albertin, C. B., O. Simakov, T. Mitros, Z. Y. Wang, J. R. Pungor, E. Edsinger-Gonzales, S. Brenner, C. W. Ragsdale, and D. S. Rokhsar. 2015. “The Octopus Genome and the Evolution of Cephalopod Neural and Morphological Novelties.” Nature 524 (7562): 220–24.
Anderson, J. B., and S. Catona. 2014. “Genomewide Mutation Dynamic Within a Long-Lived Individual of Armillaria gallica.” Mycologia 106 (4): 642–48. doi:10.3852/13-367.
Aquadro, C. F., H. Tachida, C. H. Langley, K. Harada, and T. Mukai. 1990. “Increased Variation in ADH Enzyme Activity in Drosophila Mutation-Accumulation Experiment is not Due to Transposable Elements at the Adh Structural Gene.” Genetics 126 (4): 915–19.
Araye, Q., and K. Sawamura. 2013. “Genetic Decay of Balancer Chromosomes in Drosophila melanogaster.” Fly (Austin) 7 (3): 184–86.
Arendsee, Z. W., L. Li, and E. S. Wurtele. 2014. “Coming of Age: Orphan Genes in Plants.” Trends in Plant Science 19 (11): 698–708.
Avila, V., D. Chavarrías, E. Sánchez, A. Manrique, C. López-Fanjul, and A. García-Dorado. 2006. “Increase of the Spontaneous Mutation Rate in a Long-Term Experiment with Drosophila melanogaster.” Genetics 173 (1): 267–77.
Axe, D. D. 2004. “Estimating the Prevalence of Protein Sequences Adopting Functional Enzyme Folds.” Journal of Molecular Biology 341 (5): 1295–315.
Azevedo, R. B., P. D. Keightley, C. Lauren-Maatta, L. L. Vassilieva, M. Lynch, and A. M. Leroi. 2002. “Spontaneous Mutational Variation for Body Size in Caenorhabditis elegans.” Genetics 162 (2): 755–65.
Baba, T., T. Ara, M. Hasegawa, Y. Takai, Y. Okumura, M. Baba, K. A. Datsenko et al. 2006. “Construction of Escherichia coli K-12 In-Frame, Single-Gene Knockout Mutants: The Keio Collection.” Molecular Systems Biology 2: 2006 0008. doi:10.1038/msb4100050.
Baer, C. F., F. Shaw, C. Steding, M. Baumgartner, A. Hawkins, A. Houppert, N. Mason, et al. 2005. “Comparative Evolutionary Genetics of Spontaneous Mutations Affecting Fitness in Rhabditid Nematodes.” Proceedings of the National Academy of Sciences USA 102 (16): 5785–90.
Ball, M. P., J. V. Thakuria, A. W. Zaranek, T. Clegg, A. M. Rosenbaum, X. Wu, M. Angrist, et al. 2012. “A Public Resource Facilitating Clinical Use of Genomes.” Proceedings of the National Academy of Sciences USA 109 (30): 11920–27.
Bapteste, E., L. van Iersel, A. Janke, S. Kelchner, S. Kelk, J. O. McInerney, D. A. Morrison et al. 2013. “Networks: Expanding Evolutionary Thinking.” Trends in Genetics 29 (8): 439–41.
Barrick, J. E., G. Colburn, D. E. Deatherage, C. C. Traverse, M. D. Strand, J. J. Borges, D. B. Knoester, A. Reba, and A. G. Meyer. 2014. “Identifying Structural Variation in Haploid Microbial Genomes from Short-Read Resequencing Data Using breseq.” BMC Genomics 15: 1039. doi:10.1186/1471-2164-15-1039.
Baryshnikova, A., M. Costanzo, C. L. Myers, B. Andrews, and C. Boone. 2013. “Genetic Interaction Networks: Toward an Understanding of Heritability.” Annual Review of Genomics and Human Genetics 14: 111–33.
Bégin, M., and D. J. Schoen. 2006. “Low Impact of Germline Transposition on the Rate of Mildly Deleterious Mutation in Caenorhabditis elegans.” Genetics 174 (4): 2129–36.
Blount, Z. D., C. Z. Borland, and R. E. Lenski. 2008. “Historical Contingency and the Evolution of a Key Innovation in an Experimental Population of Escherichia coli.” Proceedings of the National Academy of Sciences USA 105 (23): 7899–906.
Blount, Z. D., J. E. Barrick, C. J. Davidson, and R. E. Lenski. 2012. “Genomic Analysis of a Key Innovation in an Experimental Escherichia coli Population.” Nature 489 (7417): 513–18.
Brito, P. H., E. Guilherme, H. Soares, and I. Gordo. 2010. “Mutation Accumulation in Tetrahymena.” BMC Evolutionary Biology 10: 354. doi:10.1186/1471-2148-10-354.
Brocchieri, L., and S. Karlin. 2005. “Protein Length in Eukaryotic and Prokaryotic Proteomes.” Nucleic Acids Research 33 (10): 3390–400.
Burch, C. L., S. Guyader, D. Samarov, and H. Shen. 2007. “Experimental Estimate of the Abundance and Effects of Nearly Neutral Mutations in the RNA Virus Phi 6.” Genetics 176 (1): 467–76.
Chavarrías, D., C. López-Fanjul, and A. García-Dorado. 2001. “The Rate of Mutation and the Homozygous and Heterozygous Mutational Effects for Competitive Viability: A Long-Term Experiment with Drosophila melanogaster.” Genetics 158 (2): 681–93.
Chen, W. H., P. Minguez, M. J. Lercher, and P. Bork. 2012a. “OGEE: An Online Gene Essentiality Database.” Nucleic Acids Research 40: D901–06. doi:10.1093/nar/gkr986.
Chen, X., Z. Chen, H. Chen, Z. Su, J. Yang, F. Lin, S. Shi, and X. He. 2012b. “Nucleosomes Suppress Spontaneous Mutations Base-Specifically in Eukaryotes.” Science 335 (6073): 1235–38.
Chen, X., and J. Zhang. 2014. “Yeast Mutation Accumulation Experiment Supports Elevated Mutation Rates at Highly Transcribed Sites.” Proceedings of the National Academy of Sciences USA 111 (39): E4062. doi:10.1073/pnas.1412284111.
Christen, B., E. Abeliuk, J. M. Collier, V. S. Kalogeraki, B. Passarelli, J. A. Coller, M. J. Fero, H. H. McAdams, and L. Shapiro. 2011. “The Essential Genome of a Bacterium.” Molecular Systems Biology 7: 528. doi:10.1038/msb.2011.58.
Clark, A. G., L. Wang, and T. Hulleberg. 1995. “P-Element-Induced Variation in Metabolic Regulation in Drosophila.” Genetics 139 (1): 337–48.
Cooper, V. S., and R. E. Lenski. 2000. “The Population Genetics of Ecological Specialization in Evolving Escherichia coli Populations.” Nature 407 (6805): 736–39.
Cooper, V. S., A. F. Bennett, and R. E. Lenski. 2001. “Evolution of Thermal Dependence of Growth Rate of Escherichia coli Populations During 20,000 Generations in a Constant Environment.” Evolution 55 (5): 889–96.
Cooper, V. S. 2014. “The Origins of Specialization: Insights from Bacteria Held 25 Years in Captivity.” PLoS Biology 12: e1001790. doi:10.1371/journal.pbio.1001790.
Costanzo, M., A. Baryshnikova, J. Bellay, Y. Kim, E. D. Spear, C. S. Sevier, H. Ding, J. L. Y. Koh, et al. 2010. “The Genetic Landscape of a Cell.” Science 327 (5964): 425–31.
Criswell, D. C. 2009. “A Review of Mitoribosome Structure and Function Does not Support the Serial Endosymbiotic Theory.” Answers Research Journal 2: 107–15. https://answersingenesis.org/genetics/mitochondrialdna/mitoribosome-structure-function-and-serial-endosymbiotic-theory/.
Cuevas, J. M., S. Duffy, and R. Sanjuán. 2009. “Point Mutation Rate of Bacteriophage ΦX174.” Genetics 183 (2): 747–49.
Darwin, C. 1859. On the Origin of Species by Means of Natural Selection, or the Preservation of Favoured Races in the Struggle for Life. London, England: John Murray.
Davidson, C. J., A. P. White, and M. G. Surette. 2008. “Evolutionary Loss of the Radar Morphotype in Salmonella as a Result of High Mutation Rates During Laboratory Passage.” The ISME Journal 2 (3): 293–307.
Davies, P. 2006. The Goldilocks Enigma: Why Is the Universe Just Right for Life? New York, New York: Mariner Books.
Demuth, J. P., T. De Bie, J. E. Stajich, N. Cristianini, and M. W. Hahn. 2006. “The Evolution of Mammalian Gene Families.” PLoS One 1: e85. doi:10.1371/journal.pone.0000085.
Deng, H. W., J. Li, and J. L. Li. 1999. “On the Experimental Design and Data Analysis of Mutation Accumulation Experiments.” Genetical Research 73 (2): 147–64.
Denver, D. R., P. C. Dolan, L. J. Wilhelm, W. Sung, J. I. Lucas-Lledo, D. K. Howe, S. C. Lewis, et al. 2009. “A Genome-Wide View of Caenorhabditis elegans Base-Substitution Mutation Processes.” Proceedings of the National Academy of Sciences USA 106 (38): 16310–14.
Denver, D. R., D. K. Howe, L. J. Wilhelm, C. A. Palmer, J. L. Anderson, K. C. Stein, P. C. Phillips, and S. Estes. 2010. “Selective Sweeps and Parallel Mutation in the Adaptive Recovery from Deleterious Mutation in Caenorhabditis elegans.” Genome Research 20 (12): 1663–71.
Denver, D. R., L. J. Wilhelm, D. K. Howe, K. Gafner, P. C. Dolan, and C. F. Baer. 2012. “Variation in Base-Substitution Mutation in Experimental and Natural Lineages of Caenorhabditis Nematodes.” Genome Biology and Evolution 4 (4): 513–22.
Domingo-Calap, P., J. M. Cuevas, and R. Sanjuán. 2009. “The Fitness Effects of Random Mutations in Single-Stranded DNA and RNA Bacteriophages.” PLoS Genetics 5: e1000742. doi:10.1371/journal.pgen.1000742.
Downie, D. A. 2003. “Effects of Short-Term Spontaneous Mutation Accumulation for Life History Traits in Grape Phylloxera, Daktulosphaira vitifoliae.” Genetica 119 (3), 237–51.
Engström, G., L. E. Liljedahl, and T. Björklund. 1992. “Expression of Genetic and Environmental Variation During ageing: 2. Selection for Increased Lifespan in Drosophila melanogaster.” Theoretical and Applied Genetics 85 (1): 26–32.
Estes, S., P. C. Phillips, and D. R. Denver. 2011. “Fitness Recovery and Compensatory Evolution in Natural Mutant Lines of C. elegans.” Evolution 65 (8): 2335–44.
Ford, C. B., P. L. Lin, M. R. Chase, R. R. Shah, O. Iartchouk, J. Galagan, N. Mohaideen, et al. 2011. “Use of Whole Genome Sequencing to Estimate the Mutation Rate of Mycobacterium tuberculosis During Latent Infection.” Nature Genetics 43: 482–86.
Frair, W. 2000. “Baraminology—Classification of Created Organisms.” Creation Research Society Quarterly 37 (2): 82–91.
Fry, J. D. 2004. “On the Rate and Linearity of Viability Declines in Drosophila Mutation-Accumulation Experiments: Genomic Mutation Rates and Synergistic Epistasis Revisited.” Genetics 166 (2): 797–806.
Fry, J. D., P. D. Keightley, S. L. Heinsohn, and S. V. Nuzhdin. 1999. “New Estimates of the Rates and Effects of Mildly Deleterious Mutation in Drosophila melanogaster.” Proceedings of the National Academy of Sciences of USA 96 (2): 574–79.
Gäbel, K., J. Schmitt, S. Schulz, D. J. Näther, and J. Soppa. 2013. “A Comprehensive Analysis of the Importance of Translation Initiation Factors for Haloferax volcanii Applying Deletion and Conditional Depletion Mutants.” PLoS One 8: e77188. doi:10.1371/journal.pone.0077188.
García-Dorado, A., and A. Caballero. 2002. “The Mutational Rate of Drosophila Viability Decline: Tinkering with Old Data.” Genetical Research 80 (2): 99–105.
García-Dorado, A., and A. Gallego. 2003. “Comparing Analysis Methods for Mutation-Accumulation Data: A Simulation Study.” Genetics 164 (2): 807–19.
García-Villada, L., and J. W. Drake. 2012. “The Three Faces of Riboviral Spontaneous Mutation: Spectrum, Mode of Genome Replication, and Mutation Rate.” PLoS Genetics 8 (7): e1002832. doi:10.1371/journal.pgen.1002832.
Gauger, A. K., S. Ebnet, P. F. Fahey, and R. Seelke. 2010. “Reductive Evolution Can Prevent Populations from Taking Simple Adaptive Paths to High Fitness.” BIO-Complexity: 1–9.
Gerdes, S. Y., M. D. Scholle, J. W. Campbell, G. Balázsi, E. Ravasz, M. D. Daugherty, A. L. Somera, et al. 2003. “Experimental Determination and System Level Analysis of Essential Genes in Escherichia coli MG1655.” Journal of Bacteriology 185 (10): 5673–84.
Glass, J. I., N. Assad-Garcia, N. Alperovich, S. Yooseph, M. R. Lewis, M. Maruf, C. A. Hutchison, et al. 2006. “Essential Genes of a Minimal Bacterium.” Proceedings of the National Academy of Sciences USA 103 (2): 425–30.
Good, B. H., and M. M. Desai. 2015. “The Impact of Macroscopic Epistasis on Long-Term Evolutionary Dynamics.” Genetics 199 (1): 177–90.
Gray, J. C., and M. R. Goddard. 2012. “Gene-Flow Between Niches Facilitates Local Adaptation in Sexual Populations.” Ecology Letters 15 (9): 955–62.
Guerzoni, D., and A. McLysaght. 2011. “De Novo Origins of Human Genes.” PLoS Genetics 7 (11): e1002381. doi:10.1371/journal.pgen.1002381.
Haag-Liautard, C., M. Dorris, X. Maside, S. Macaskill, D. L. Halligan, D. Houle, B. Charlesworth, and P. D. Keightley. 2007. “Direct Estimation of per Nucleotide and Genomic Deleterious Mutation Rates in Drosophila.” Nature 445: 82–85.
Haag-Liautard, C., N. Coffey, D. Houle, M. Lynch, B. Charlesworth, and P. D. Keightley. 2008. “Direct Estimation of the Mitochondrial DNA Mutation Rate in Drosophila melanogaster.” PLoS Biology 6 (8): e204. doi:10.1371/journal.pbio.0060204.
Hall, D. W., R. Mahmoudizad, A. W. Hurd, and S. B. Joseph. 2008. “Spontaneous Mutations in Diploid Saccharomyces cerevisiae: Another Thousand Cell Generations.” Genetics Research 90 (3): 229–41. doi:10.1017/S0016672308009324.
Hall, D. W., S. Fox, J. J. Kuzdzal-Fick, J. E. Strassmann, and D. C. Queller. 2013. “The Rate and Effects of Spontaneous Mutation on Fitness Traits in the Social Amoeba, Dictyostelium discoideum.” G3 (Bethesda) 3 (7): 1115–27. doi:10.1534/g3.113.005934.
Harpur, B. A., C. F. Kent, D. Molodtsova, J. M. Lebon, A. S. Alqarni, A. A. Owayss, and A. Zayed. 2014. “Population Genomics of the Honey Bee Reveals Strong Signatures of Positive Selection on Worker Traits.” Proceedings of the National Academy of Sciences USA 111 (7): 2614–19.
Hayashi, K., N. Morooka, Y. Yamamoto, K. Fujita, K. Isono, S. Choi, E. Ohtsubo, et al. 2006. “Highly Accurate Genome Sequences of Escherichia coli K-12 Strains MG1655 and W3110.” Molecular Systems Biology 2: 2006 0007. doi:10.1038/msb4100049.
Heilbron, K., M. Toll-Riera, M. Kojadinovic, and R. C. MacLean. 2014. “Fitness is Strongly Influenced by Rare Mutations of Large Effect in a Microbial Mutation Accumulation Experiment.” Genetics 197 (3): 981–90.
Hillenmeyer, M. E., E. Fung, J. Wildenhain, S. E. Pierce, S. Hoon, W. Lee, M. Proctor, et al. 2008. “The Chemical Genomic Portrait of Yeast: Uncovering a Phenotype for All Genes.” Science 320 (5874): 362–65.
Houle, D., and S. V. Nuzhdin. 2004. “Mutation Accumulation and the Effect of Copia Insertions in Drosophila melanogaster.” Genetical Research 83 (1): 7–18.
Huang, W., A. Massouras, Y. Inoue, J. Peiffer, M. Rámia, A. Tarone, L. Turlapati, et al. 2014. “Natural Variation in Genome Architecture Among 205 Drosophila melanogaster Genetic Reference Panel Lines.” Genome Research 24 (7): 1193–208.
Jeanson, N. T. 2013. “Recent, Functionally Diverse Origin for Mitochondrial Genes from ~2700 Metazoan Species.” Answers Research Journal 6: 467–501. https://answersingenesis.org/genetics/mitochondrial-dna/recent-functionally-diverse-origin-for-mitochondrial-genes-from-~2700-metazoan-species/.
Joseph, S. B., and D. W. Hall. 2004. “Spontaneous Mutations in Diploid Saccharomyces cerevisiae: More Beneficial than Expected.” Genetics 168 (4): 1817–25.
Kaboli, S., T. Yamakawa, K. Sunada, T. Takagaki, Y. Sasano, M. Sugiyama, Y. Kaneko, and S. Harashima. 2014. “Genome-Wide Mapping of Unexplored Essential Regions in the Saccharomyces cerevisiae Genome: Evidence for Hidden Synthetic Lethal Combinations in a Genetic Interaction Network.” Nucleic Acids Research 42 (15): 9838–53.
Kaessmann, H. 2010. “Origins, Evolution, and Phenotypic Impact of New Genes.” Genome Research 20 (10): 1313–26.
Katju, V., L. B. Packard, L. Bu, P. D. Keightley, and U. Bergthorsson. 2015. “Fitness Decline in Spontaneous Mutation Accumulation Lines of Caenorhabditis elegans with Varying Effective Population Sizes.” Evolution 69: 104–16.
Kavanaugh, C. M., and R. G. Shaw. 2005. “The Contribution of Spontaneous Mutation to Variation in Environmental Responses of Arabidopsis thaliana: Responses to Light.” Evolution 59 (2): 266–75.
Keightley, P. D., and A. Caballero. 1997. “Genomic Mutation Rates for Lifetime Reproductive Output and Lifespan in Caenorhabditis elegans.” Proceedings of the National Academy of Sciences USA 94 (8): 3823–27.
Keightley, P. D., and M. Lynch. 2003. “Toward a realistic model of mutations affecting fitness.” Evolution 57 (3): 683–85.
Keightley, P. D., U. Trivedi, M. Thomson, F. Oliver, S. Kumar, and M. L. Blaxter. 2009. “Analysis of the Genome Sequences of Three Drosophila melanogaster Spontaneous Mutation Accumulation Lines.” Genome Research 19 (7): 1195–201.
Keightley, P. D., R. W. Ness, D. L. Halligan, and P. R. Haddrill. 2014. “Estimation of the Spontaneous Mutation Rate per Nucleotide Site in a Drosophila melanogaster Full-Sib Family.” Genetics 196 (1): 313–20.
Khalturin, K., G. Hemmrich, S. Fraune, R. Augustin, and T. C. G. Bosch. 2009. “More Than Just Orphans: Are Taxonomically-Restricted Genes Important in Evolution?” Trends in Genetics 25 (9): 404–13.
Koonin, E. V. 2007. “The Biological Big Bang Model for the Major Transitions in Evolution.” Biology Direct 2: 21. doi:10.1186/1745-6150-2-21.
Koonin, E. V., and Y. I. Wolf. 2009. “The Fundamental Units, Processes and Patterns of Evolution, and the Tree of Life Conundrum.” Biology Direct 4: 33. doi:10.1186/1745-6150-4-33.
Koonin, E. V., Y. I. Wolf, and P. Puigbò. 2009. “The Phylogenetic Forest and the Quest for the Elusive Tree of Life.” Cold Spring Harbor Symposia on Quantitative Biology 74: 205– 13. doi:10.1101/sqb.2009.74.006. Koonin, E. V., P. Puigbò, and Y. I. Wolf. 2011. “Comparison of Phylogenetic Trees and Search for a Central Trend in the “Forest of Life”. Journal of Computational Biology 18 (7): 917–24.
Kuzdzal-Fick, J. J., S. A. Fox, J. E. Strassmann, and D. C. Queller. 2011. “High Relatedness is Necessary and Sufficient to Maintain Multicellularity in Dictyostelium.” Science 334 (6062): 1548–51.
Lau, K. F., and K. A. Dill. 1990. “Theory for Protein Mutability and Biogenesis.” Proceedings of the National Academy Sciences USA 87 (2): 638–42.
Lee, H., E. Popodi, H. Tang, and P. L. Foster. 2012. “Rate and Molecular Spectrum of Spontaneous Mutations in the Bacterium Escherichia coli as Determined by Whole-Genome Sequencing.” Proceedings of the National Academy of Sciences USA 109 (41): E2774–83. doi:10.1073/pnas.1210309109.
Lee, M. C., and C. J. Marx. 2012. “Repeated, Selection-Driven Genome Reduction of Accessory Genes in Experimental Populations.” PLoS Genetics 8 (5): e1002651. doi:10.1371/journal.pgen.1002651.
Leiby, N., and C. J. Marx. 2014. “Metabolic Erosion Primarily Through Mutation Accumulation, and not Tradeoffs, Drives Limited Evolution of Substrate Specificity in Escherichia coli.” PLoS Biology 12 (2): e1001789. doi:10.1371/journal. pbio.1001789. doi:10.1371/journal.pbio.1001789.
Leigh, J. W., F. J. Lapointe, P. Lopez, and E. Bapteste. 2011. “Evaluating Phylogenetic Congruence in the Post-Genomic Era.” Genome Biology and Evolution 3: 571–87. Lewin, R. 1980. “Evolutionary Theory Under Fire.” Science 210 (4472): 883–87.
Liao, B. Y., and J. Zhang. 2007. “Mouse Duplicate Genes are as Essential as Singletons.” Trends in Genetics 23 (8): 378–81.
Lind, P. A., and D. I. Andersson. 2008. “Whole-Genome Mutational Biases in Bacteria.” Proceedings of the National Academy of Sciences USA 105 (46): 17878–883.
Loewe, L., V. Textor, and S. Scherer. 2003. “High Deleterious Genomic Mutation Rate in Stationary Phase of Escherichia coli.” Science 302 (5650): 1558–60.
Long, H. A., T. Paixão, R. B. Azevedo, and R. A. Zufall. 2013. “Accumulation of Spontaneous Mutations in the Ciliate Tetrahymena thermophila.” Genetics 195 (2): 527–40.
Long, M., E. Betrán, K. Thornton, and W. Wang. 2003. “The Origin of New Genes: Glimpses from the Young and Old.” Nature Reviews Genetics 4 (11): 865–75.
Long, Q., F. A. Rabanal, D. Meng, C. D. Huber, A. Farlow, A. Platzer, Q. Zhang, et al. 2013. “Massive Genomic Variation and Strong Selection in Arabidopsis thaliana Lines from Sweden.” Nature Genetics 45 (8): 884–90.
Lynch, M., W. Sung, K. Morris, N. Coffey, C. R. Landry, E. B. Dopman, W. J. Dickinson, et al. 2008. “A Genome-Wide View of the Spectrum of Spontaneous Mutations in Yeast.” Proceedings of the National Academy of Sciences USA 105 (27): 9272–77.
Maklakov, A. A. 2013. “Aging: Why Do Organisms Live Too Long?” Current Biology 23 (22): R1003–05. doi:10.1016/j.cub.2013.10.002.
Mallet, M. A., C. M. Kimber, and A. K. Chippindale. 2012. “Susceptibility of the Male Fitness Phenotype to Spontaneous Mutation.” Biology Letters 8 (3): 426–29. doi:10.1098/rsbl.2011.0977.
Maside, X., S. Assimacopoulos, and B. Charlesworth. 2000. “Rates of Movement of Transposable Elements on the Second Chromosome of Drosophila melanogaster.” Genetical Research 75 (3): 275–84.
Matsuba, C., S. Lewis, D. G. Ostrow, M. P. Salomon, L. Sylvestre, B. Tabman, J. Ungvari-Martin, and C. F. Baer. 2012. “Invariance (?) of Mutational Parameters for Relative Fitness over 400 Generations of Mutation Accumulation in Caenorhabditis elegans.” G3 (Bethesda) 2 (12): 1497–503.
McGuigan, K., D. Petfield, and M. W. Blows. 2011. “Reducing Mutation Load Through Sexual Selection on Males.” Evolution 65 (10): 2816–29.
Meyer, S. C. 2009. Signature in the Cell. Kindle Edition. Harper One.
Morgan, A. D., R. W. Ness, P. D. Keightley, and N. Colegrave. 2014. “Spontaneous Mutation Accumulation in Multiple Strains of the Green Alga, Chlamydomonas reinhardtii.” Evolution 68 (9): 2589–602.
Neme, R., and D. Tautz. 2013. “Phylogenetic Patterns of Emergence of New Genes Support a Model of Frequent de novo Evolution.” BMC Genomics 14: 117. doi:10.1186/1471-2164-14-117.
Ness, R. W., A. D. Morgan, N. Colegrave, and P. D. Keightley. 2012. “Estimate of the Spontaneous Mutation Rate in Chlamydomonas reinhardtii.” Genetics 192 (4): 1447–54.
Nishant, K. T., W. Wei, E. Mancera, J. L. Argueso, A. Schlattl, N. Delhomme, X. Ma, et al. 2010. “The Baker’s Yeast Diploid Genome is Remarkably Stable in Vegetative Growth and Meiosis.” PLoS Genetics 6 (9): e1001109. doi:10.1371/journal.pgen.1001109.
Nusse, R. 2005. “Wnt Signaling in Disease and in Development.” Cell Research 15 (1): 28–32.
Ooi, S. L., X. Pan, B. D. Peyser, P. Ye, P. B. Meluh, D. S. Yuan, R. A. Irizarry, J. S. Bader, F. A. Spencer, and J. D. Boeke. 2006. “Global Synthetic-Lethality Analysis and Yeast Functional Profiling.” Trends in Genetics 22 (1): 56–63.
Ossowski, S., K. Schneeberger, J. I. Lucas-Lledó, N. Warthmann, R. M. Clark, R. G. Shaw, D. Weigel, and M. Lynch. 2010. “The Rate and Molecular Spectrum of Spontaneous Mutations in Arabidopsis thaliana.” Science 327 (5961): 92–94.
Pannebakker, B. A., D. L. Halligan, K. T. Reynolds, G. A. Ballantyne, D. M. Shuker, N. H. Barton, and S. A. West. 2008. “Effects of Spontaneous Mutation Accumulation on Sex Ratio Traits in a Parasitoid Wasp.” Evolution 62 (8): 1921–35.
Papaceit, M., V. Avila, M. Aguadé, and A. García-Dorado. 2007. “The Dynamics of the Roo Transposable Element in Mutation-Accumulation Lines and Segregating Populations of Drosophila melanogaster.” Genetics 177 (1): 511–22.
Pikaard, C. S. 2002. “Transcription and Tyranny in the Nucleolus: The Organization, Activation, Dominance and Repression of Ribosomal RNA Genes.” The Arabidopsis Book 1: e0083.
Puigbò, P., Y. I. Wolf, and E. V. Koonin. 2009. “Search for a ‘Tree of Life’ in the Thicket of the Phylogenetic Forest.” Journal of Biology 8 (6): 59. doi:10.1199/tab.0083.
Puigbò, P., Y. I. Wolf, and E. V. Koonin. 2012. “Genome-Wide Comparative Analysis of Phylogenetic Trees: The Prokaryotic Forest of Life.” Methods in Molecular Biology 856: 53–79.
Puigbò, P., Y. I. Wolf, and E. V. Koonin. 2013. “Seeing the Tree of Life Behind the Phylogenetic Forest.” BMC Biology 11: 46. doi:10.1186/1741-7007-11-46.
Raeside, C., J. Gaffé, D. E. Deatherage, O. Tenaillon, A. M. Briska, R. N. Ptashkin, S. Cruveiller, et al. 2014. “Large Chromosomal Rearrangements During a Long-Term Evolution Experiment with Escherichia coli.” mBio 5: e01377-01314. doi:10.1128/mBio.01377-14.
Ramani, A. K., T. Chuluunbaatar, A. J. Verster, H. Na, V. Vu, N. Pelte, N. Wannissorn, A. Jiao, and A. G. Fraser. 2012. “The Majority of Animal Genes are Required for Wild-Type Fitness.” Cell 148 (4): 792–802.
Rasmussen, M., X. Guo, Y. Wang, K. E. Lohmueller, S. Rasmussen, A. Albrechtsen, L. Skotte, et al. 2011. “An Aboriginal Australian Genome Reveals Separate Human Dispersals into Asia.” Science 334 (6052): 94–98.
Rau, M. H., R. L. Marvig, G. D. Ehrlich, S. Molin, and L. Jelsbak. 2012. “Deletion and Acquisition of Genomic Content During Early Stage Adaptation of Pseudomonas aeruginosa to a Human Host Environment.” Environmental Microbiology 14 (8): 2200–11.
Reidhaar-Olson, J. F., and R. T. Sauer. 1990. “Functionally Acceptable Substitutions in Two α-Helical Regions of λ Repressor.” Proteins 7 (4): 306–16.
Roles, A. J., and J. K. Conner. 2008. “Fitness Effects of Mutation Accumulation in a Natural Outbred Population of Wild Radish (Raphanus raphanistrum): Comparison of Field and Greenhouse Environments.” Evolution 62 (5): 1066–75.
Rutter, M. T., A. Roles, J. K. Conner, R. G. Shaw, F. H. Shaw, K. Schneeberger, S. Ossowski, D. Weigel, and C. B. Fenster. 2012. “Fitness of Arabidopsis thaliana Mutation Accumulation Lines Whose Spontaneous Mutations are Known.” Evolution 66 (7): 2335–39.
Salgado, C., B. Nieto, M. A. Toro, C. López-Fanjul, and A. García-Dorado. 2005. “Inferences on the Role of Insertion in a Mutation Accumulation Experiment with Drosophila melanogaster using RAPDs.” Journal of Heredity 96 (5): 576–81.
Saxer, G., P. Havlak, S. A. Fox, M. A. Quance, S. Gupta, Y. Fofanov, J. E. Strassmann, and D. C. Queller. 2012. “Whole Genome Sequencing of Mutation Accumulation Lines Reveals a Low Mutation Rate in the Social Amoeba Dictyostelium discoideum.” PLoS One 7: e46759. doi:10.1371/journal.pone.0046759.
Schenk, M. F., I. G. Szendro, M. L. M. Salverda, J. Krug, and J. A. G. M. de Visser. 2013. “Patterns of Epistasis Between Beneficial Mutations in an Antibiotic Resistance Gene.” Molecular Biology and Evolution 30 (8): 1779–87.
Schrider, D. R., D. Houle, M. Lynch, and M. W. Hahn. 2013. “Rates and Genomic Consequences of Spontaneous Mutational Events in Drosophila melanogaster.” Genetics 194 (4): 937–54.
Schultz, S. T., and D. G. Scofield. 2009. “Mutation Accumulation in Real Branches: Fitness Assays for Genomic Deleterious Mutation Rate and Effect in Large-Statured Plants.” The American Naturalist 174 (2): 163–75.
Schuster, S. C., W. Miller, A. Ratan, L. P. Tomsho, B. Giardine, L. R. Kasson, R. S. Harris, et al. 2010. “Complete Khoisan and Bantu Genomes from Southern Africa.” Nature 463: 943–47.
Shabalina, S. A., L. Y. Yampolsky, and A. S. Kondrashov, A.S. 1997. “Rapid Decline of Fitness in Panmictic Populations of Drosophila melanogaster Maintained under Relaxed Natural Selection.” Proceedings of the National Academy of Sciences USA 94 (24): 13034–39.
Sharp, N. P., and A. F. Agrawal. 2013. “Male-Biased Fitness Effects of Spontaneous Mutations in Drosophila melanogaster.” Evolution 67 (4): 1189–95.
Sousa, A., C. Bourgard, L. M. Wahl, and I. Gordo. 2013. “Rates of Transposition in Escherichia coli.” Biology Letters 9 (6): 20130838. doi:10.1098/rsbl.2013.0838.
Suárez-Diaz, E., and V. H. Anaya-Muñoz. 2008. “History, Objectivity, and the Construction of Molecular Phylogenies.” Studies in History and Philosophy of Biological and Biomedical Sciences 39 (4): 451–68.
Sung, W., M. S. Ackerman, S. F. Miller, T. G. Doak, and M. Lynch. 2012a. “Drift-Barrier Hypothesis and Mutation-Rate Evolution.” Proceedings of the National Academy of Sciences USA 109 (45): 18488–92.
Sung, W. A. E. Tucker, T. G. Doak, E. Choi, W. K. Thomas, and M. Lynch. 2012b. “Extraordinary Genome Stability in the Ciliate Paramecium tetraurelia.” Proceedings of the National Academy of Sciences USA 109 (47): 19339–44.
Sung, W., M. S. Ackerman, J. F. Gout, S. F. Miller, E. Williams, P. L. Foster, and M. Lynch. 2015. “Asymmetric Context-Dependent Mutation Patterns Revealed through Mutation-Accumulation Experiments.” Molecular Biology and Evolution 32 (7): 1672–83.
Tan, C., and J. P. Tomkins. 2015a. “Information Processing Differences Between Archaea and Eukarya—Implications for Homologs and the Myth of Eukaryogenesis.” Answers Research Journal 8: 121–41. https://answersingenesis.org/biology/microbiology/information-processing-differences-between-archaea-and-eukarya/.
Tan, C., and J. P. Tomkins, 2015b. “Information Processing Differences Between Bacteria and Eukarya—Implications for the Myth of Eukaryogenesis.” Answers Research Journal 8: 143–62. https://answersingenesis.org/biology/microbiology/information-processing-differences-between-bacteria-and-eukarya/.
Tautz, D., and T. Domazet-Lošo. 2011. “The Evolutionary Origin of Orphan Genes.” Nature Reviews Genetics 12 (10): 692702. Taylor, S. V., K. U. Walter, P. Kast, and D. Hilvert. 2001. “Searching Sequence Space for Protein Catalysts.” Proceedings of the National Academy of Sciences USA 98 (19): 10596–601.
Tekmal, R. R., and N. Keshava. 1997. “Role of MMTV Integration Locus Cellular Genes in Breast Cancer.” Frontiers in Bioscience 2: d519–26. doi no:10:2741/A209.
Toll-Riera, M., N. Bosch, N. Bellora, R. Castelo, L. Armengol, X. Estivill, and M. M. Albà. 2009. “Origin of Primate Orphan Genes: A Comparative Genomics Approach.” Molecular Biology and Evolution 26 (3): 603–12.
Tomkins, J. P. 2013. “Comprehensive Analysis of Chimpanzee and Human Chromosomes Reveals Average DNA Similarity of 70%.” Answers Research Journal 6: 63–69. https://answersingenesis.org/answers/research-journal/v6/comprehensive-analysis-of-chimpanzee-and-human-chromosomes/.
Tomkins, J. P., and J. Bergman. 2013. “Incomplete Lineage Sorting and Other ‘Rogue’ Data Fell the Tree of Life.” Journal of Creation 27 (3): 84–92.
Tong, A. H., M. Evangelista, A. B. Parsons, H. Xu, G. D. Bader, N. Pagé, M. Robinson, et al. 2001. “Systematic Genetic Analysis with Ordered Arrays of Yeast Deletion Mutants.” Science 294 (5550): 2364–68.
Tong, A. H., G. Lesage, G. D. Bader, H. Ding, H. Xu, X. Xin, J. Young, et al. 2004. “Global Mapping of the Yeast Genetic Interaction Network.” Science 303 (5659): 808–13.
Trindade, S., L. Perfeito, and I. Gordo. 2010. “Rate and Effects of Spontaneous Mutations that Affect Fitness in Mutator Escherichia coli.” Philosophical Transactions of the Royal Society of London Series B, Biological Sciences 365 (1544): 1177–86.
Tucker, C. L., and S. Fields. 2003. “Lethal Combinations.” Nature Genetics 35: 204–05.
Vassilieva, L. L., A. M. Hook, and M. Lynch. 2000. “The Fitness Effects of Spontaneous Mutations in Caenorhabditis elegans.” Evolution 54 (4): 1234–46.
Wallberg, A., F. Han, G. Wellhagen, B. Dahle, M. Kawata, N. Haddad, Z. L. P. Simőes, et al. 2014. “A Worldwide Survey of Genome Sequence Variation Provides Insight into the Evolutionary History of the Honeybee Apis mellifera.” Nature Genetics 46 (10): 1081–88.
Weber, K. P., S. De, I. Kozarewa, D. J. Turner, M. M. Babu, and M. de Bono. 2010. “Whole Genome Sequencing Highlights Genetic Changes Associated with Laboratory Domestication of C. elegans.” PLoS One 5 (11): e13922. doi:10.1371/journal.pone.0013922.
Wei, W., L. W. Ning, Y. N. Ye, S. J. Li, H. Q. Zhou, J. Huang, and F. B. Guo. 2014. “SMAL: A Resource of Spontaneous Mutation Accumulation Lines.” Molecular Biology and Evolution 31 (5): 1302–08.
Weinreich, D. M., N. F. Delaney, M. A. Depristo, and D. L. Hartl. 2006. “Darwinian Evolution Can Follow Only Very Few Mutational Paths to Fitter Proteins.” Science 312 (5770): 111–14.
Wijaya, E., M. C. Frith, P. Horton, and K. Asai. 2013. “Finding Protein-Coding Genes Through Human Polymorphisms.” PLoS One 8: e54210. doi:10.1371/journal.pone.0054210.
Wilson, G. A., N. Bertrand, Y. Patel, J. B. Hughes, E. J. Feil, and D. Field. 2005. “Orphans as Taxonomically Restricted and Ecologically Important Genes.” Microbiology 151 (8): 2499–501.
Wilson, G. A., E. J. Feil, A. K. Lilley, and D. Field. 2007. “Large-Scale Comparative Genomic Ranking of Taxonomically Restricted Genes (TRGs) in Bacterial and Archaeal Genomes.” PLoS One 2 (3): e324. doi:10.1371/journal. pone.0000324.
Wise, K. P. 1990. “Baraminology: A Young-Earth Creation Biosystematic Method.” In Proceedings of the Second International Conference on Creationism. Edited by R. E. Walsh, 345–60. Pittsburgh, Pennsylvania: Creation Science Fellowship.
Wissler, L., J. Gadau, D. F. Simola, M. Helmkampf, and E. Bornberg-Bauer. 2013. “Mechanisms and Dynamics of Orphan Gene Emergence in Insect Genomes.” Genome Biology and Evolution 5 (2): 439–55.
Wolf, Y. I., P. S. Novichkov, G. P. Karev, E. V. Koonin, and D. J. Lipman. 2009. “The Universal Distribution of Evolutionary Rates of Genes and Distinct Characteristics of Eukaryotic Genes of Different Apparent Ages.” Proceedings of the National Academy of Sciences USA 106 (18): 7273–80.
Wood, T. C. 2006. “The Current Status of Baraminology.” Creation Research Society Quarterly 43 (3): 149–58.
Wood, T. C., K. P. Wise, R. Sanders, and N. Doran. 2003. “A Refined Baramin Concept.” Occasional Papers of the Baraminology Study Group 3: 1–14.
Wu, D. D., D. M. Irwin, and Y. P. Zhang. 2011. De novo origin of human protein-coding genes. PLoS Genetics 7: e1002379. doi:10.1371/journal.pgen.1002379.
Xu, S., S. Schaack, A. Seyfert, E. Choi, M. Lynch, and M. E. Cristescu. 2012. “High Mutation Rates in the Mitochondrial Genomes of Daphnia pulex.” Molecular Biology and Evolution 29, (2): 763–69. doi:10.1093/molbev/msr243.
Yampolsky, L. Y., C. Allen, S. A. Shabalina, and A. S. Kondrashov. 2005. “Persistence Time of Loss-of-Function Mutations at Nonessential Loci Affecting Eye Color in Drosophila melanogaster.” Genetics 171 (4): 2133–38.
Yang, L., M. Zou, B. Fu, and S. He. 2013. “Genome-Wide Identification, Characterization, and Expression Analysis of Lineage-Specific Genes within Zebrafish.” BMC Genomics 14: 65. doi:10.1186/1471-2164-14-65.
Zhang, Y. E., and M. Long. 2014. “New Genes Contribute to Genetic and Phenotypic Novelties in Human Evolution.” Current Opinion in Genetics and Development 29: 90–96. doi:10.1016/j.gde.2014.08.013.
Zhang, Y. E., M. D. Vibranovski, P. Landback, G. A. B. Marais, and M. Long. 2010. “Chromosomal Redistribution of Male-Biased Genes in Mammalian Evolution with Two Bursts of Gene Gain on the X Chromosome.” PLoS Biology 8 (10): e1000494. doi:10.1371/journal.pbio.1000494.
Zhu, Y. O., M. L. Siegal, D. W. Hall, and D. A. Petrov. 2014. “Precise Estimates of Mutation Rate and Spectrum in Yeast.” Proceedings of the National Academy of Sciences USA 111 (22): E2310-2318. doi:10.1073/pnas.1323011111.
Zinovyev, A., I. Kuperstein, E. Barillot, and W. D. Heyer. 2013. “Synthetic Lethality Between Gene Defects Affecting a Single Non-Essential Molecular Pathway with Reversible Steps.” PLoS Computational Biology 9 (4): e1003016. doi:10.1371/journal.pcbi.1003016.