

How Much Global Warming Is Natural?
Abstract
The concern over global warming seems to be escalating. But what do the data show?
Keywords: Global Warming, natural, solar irradiance, sunspots, Little Ice Age, Medieval Warm Period, climate, aerosols, faculae, statistics
The concern over global warming seems to be escalating. We hear a steady media drumbeat that man has caused practically all the global warming, and we need to act now to avoid disaster. Al Gore seems to be the leader in all this hype with his movie and book, An Inconvenient Truth.1 Although backing away from the sea level rise that is supposed to occur by 2100 (one foot),2 the United-Nations-sponsored Intergovernmental Panel of Climate Change (IPCC) continued the drumbeat in its latest 2007 report. The most widely read scientific journals Science and Nature have an article on the effects and dangers of man-made global warming almost weekly. Outlandish statements are rampant, such as: “A well-known environmental spokesperson warns that future sea-level rise will drown much of creation.”3 A woman even aborted her baby, saying that she was reducing her “carbon footprint.”
All these voices assume that practically all the 1.2°F global warming since 1880 is caused by man, and only a tiny bit is natural. But other voices can be found in the recent literature that conclude that natural processes are significant, especially before 1980.4,5,6,7,8,9,10,11 In fact, many researchers believe that natural process are predominant before 1980.
Natural Solar Irradiance
There are several natural processes that can affect global temperatures. One of them is El Niño, a warming of the ocean water near the Pacific equator, which also causes global warming of the atmosphere. It is responsible for the anomalous warm year of 1998.
Then there are volcanic eruptions that spread sulfur aerosols (tiny particles about the size of a micron or less) into the stratosphere, which reflect some of the sunlight back to space, cooling the surface. Such aerosols slowly fall out of the stratosphere and have been observed to cool the earth up to about one degree Fahrenheit for a few years.
However, the most significant and long-lasting natural process is the change in total solar irradiance (TSI) from the sun. I was taught in atmospheric science classes in college that the sunlight is never changing. In fact, the amount of sunshine at the top of the atmosphere was called the “solar constant.” However, ever since satellites have been measuring solar radiation since 1978, we now realize that the sunshine isn’t constant. It changes by a slight amount due to sunspots and faculae that change with time on the sun’s surface. Sunspots are dark, cool spots, while faculae are bright, hot spots—they usually occur together.12 The net effect is that when there are many cooler sunspots, the hot faculae more than make up for the cool spots. Thus, there is more solar radiation when there are more sunspots.
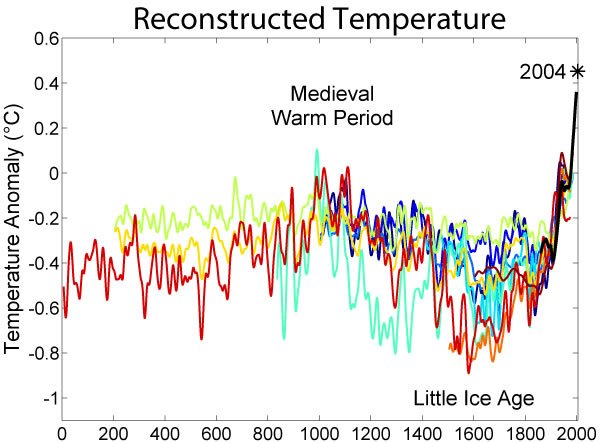
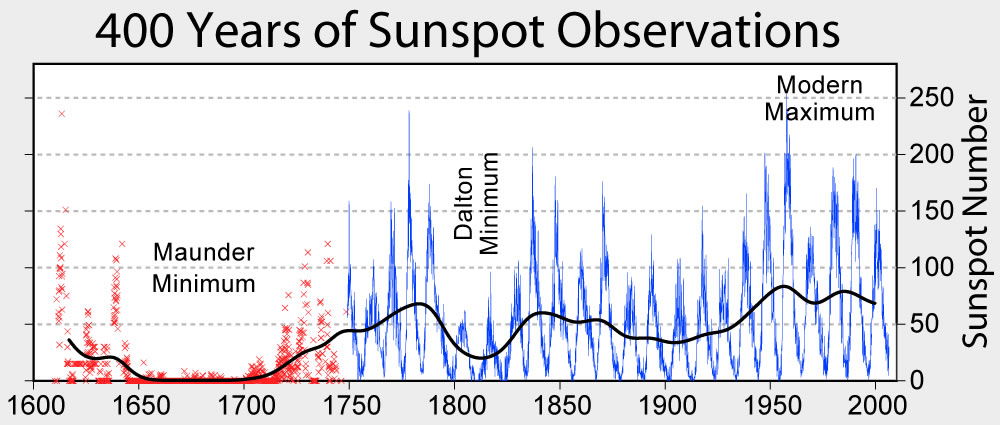
Sunspots run in cycles. There is the familiar 11-year cycle. Then there is a 22-year cycle, and there is a long period, chaotic cycle that lasts several hundred years. During the Little Ice Age that lasted from about 1300 to 1880, sunspots were at a general minimum, suggesting that effects on the sun caused the Little Ice Age. During this time, practically all the glaciers in the world advanced, and unusual cold spawned a number of disasters. In fact, there were three periods during the Little Ice Age when the number of sunspots was quite small compared to the average. One of those is the Maunder Minimum, between 1645 to 1715, in which about 50 sunspots were detected during the entire period, while normally there should be 40,000 to 50,000 spots.13 This was one of the coldest periods of the Little Ice Age.
Click to enlarge
Source: Global Warming Art
Before the Little Ice Age, there was the Medieval Warm Period between about 900 and 1300. This was the time when the Vikings colonized southwest Greenland, and records indicate that good wine grapes were grown in southern England. Since sunspots have been detected only since 1610, the evidence for the Medieval Warm Period relies on carbon-14 in tree rings and beryllium-10 in ice cores. These proxies, as they are called, which are generally good for the past one or two thousand years,14 indicate that sunspot activity was very high during the Medieval Warm Period.15,16 This warm period has sometimes been denied or minimized by advocates of man-made global warming. So, if the sun can cause the dramatic effects of the Medieval Warm Period and the Little Ice Age, when carbon dioxide was in steady state, then why can’t the sun be causing a significant amount of global warming since the Little Ice Age?
More Recent Statistical Analysis
Click to enlarge
Source: Global Warming Art
One of the main reasons why alarmists have minimized the effects of the sun on climate is because the mechanism of how slight changes in TSI can warm or cool the climate by a degree or two is poorly known.17 One promising recent hypothesis is that when the number of sunspots is low, the sun’s magnetic field is weaker, causing more cosmic rays to impinge on the Earth.18 More cosmic rays may cause more cloudiness, which reflects more sunlight back to space cooling the earth’s surface.
Because of controversial hypotheses linking the sun to climate, researchers have had to resort to statistical comparisons. Scafetta and West have led this research over the past several years, showing statistically that the changes in TSI on the sun are significantly correlated to global warming since 1900 and even before.17 Because global warming increased significantly from 1910 to about 1950, proportional to the TSI, while carbon dioxide increased only a little, Scafetta and West attribute 76% of the warming to natural causes on the sun!18 Then there was a cooling period in the 1950s to 1970s, again proportional to TSI, but totally missed by increasing carbon dioxide. Some readers may remember the books and magazine articles that came out in the 1970s predicting the next ice age was due soon.
The period from 1980 to the present is questionable and controversial as to how much of the strong rise in global warming was natural and how much was manmade. Scafetta and West believe that only 25 to 35% of this warming is due to natural causes while the rest is manmade.18 However, even this percentage is controversial because there is more than one estimate of TSI. Scafetta and West use a compromise TSI between a reconstruction that shows only a small change and one that shows a large change in TSI since 1980. Alarmists seem to focus on the one that shows the small change. For the twentieth century, Scafetta and West estimate natural causes from the sun contributed 45 to 50% to the global warming.

Click to enlarge
Source: Global Warming Art
Scafetta and West have recently updated their figures and reported an even stronger correlation between global warming and natural changes in sunlight.19 They show that monthly global average temperatures correlate to the 11-year, 22-year, and longer-term TSI cycle. Because sunspots are relatively low at present in the 11-year cycle, the decreased sunlight is correlated to cooler temperatures since 2002: “In particular, since 2002 the temperature data present a global cooling, not a warming!”20 They conclude:
The non-equilibrium thermodynamic models we used suggest that the Sun is influencing climate significantly more than the IPCC report claims. If climate is as sensitive to solar changes as the above phenomenological [statistical] findings suggest, the current anthropogenic contribution to global warming is significantly overestimated. We estimate that the Sun could account for as much as 69% of the increase in Earth’s average temperature, depending on the TSI reconstruction used.20
The reason that climate models and the IPCC have not picked up on the strong influence of the sun on temperatures is because present-day climate models dismiss the variability in monthly average global temperature as climate noise, and hence ignore it. They also use the TSI that shows the lowest amount of solar irradiance since 1980.
Natural processes are obviously affecting the surface temperature. I will stick with my previous estimate of 50% natural and 50% manmade,21 since the figure of 69% ever since about 1900 used by Scafetta and West is for a medium to high TSI estimate for the past 25 to 30 years. If the low TSI is correct (Scafetta and West think not) and manmade global warming has dominated during the past 25 to 30 years, the century average would be around 50%, since natural processes on the sun dominated before 1980.
What Does It All Mean?
What this means is that manmade global warming is only about 0.6°F, while the sun contributed another 0.6°F. Man’s contribution is slight, and not enough manmade warming has occurred to panic over. There is a good chance that man can do nothing or only very little to change the manmade portion, even if he spent what alarmist suggest to “fight” global warming (although we should always have been and should continue to be good stewards of the resources God has provided us). We have plenty of time for research.22 We can also learn to adapt by making changes, if global warming continues its slow upward trend, such as building dikes for rising sea level. (Some scientists are actually predicting global cooling in the future based on trends on the sun, but this remains to be seen.) Spending hundreds of billions of dollars a year to “fight” global warming just doesn’t make sense, and is more likely to ruin the economies of first-world nations than make any significant impact.

Footnotes
- Gore, A., An Inconvenient Truth: The Planetary Emergency of Global Warming and What We Can Do About It (New York: Rodale, 2006).
- Lomborg, B., Cool It; The Skeptical Environmentalists Guide to Global Warming (New York: Alfred A. Knopf, 2007), pp. 60–72.
- Ruddiman, W., “Act now (but how?),” Science 319 (2008):285.
- Crowley, T. J., and Kim, K.-Y., “Comparison of Proxy Records of Climate Change and Solar Forcing, Geophysical Research Letters 23 no. 4 (1996):359–362.
- Cliver, E. W., Boriakoff, V., and Feynman, J., “Solar Variability and Climate Change: Geomagnetic AA Index and Global Surface Temperature,” Geophysical Research Letters 25 no. 7 (1998):1,035–1,038.
- Foukal, P., “A Comparison of Variable Solar Total and Ultraviolet Irradiance Outputs in the 20th Century,” Geophysical Research Letters 29 no. 23 (2002):1–4.
- Ammann, C. M., Meehl, G. A., Washington, W. M., and Zender, C. S., “A Monthly and Latitudinally Varying Volcanic Forcing Dataset in Simulations of 20th Century Climate,” Geophysical Research Letters 30 no. 12 (2003):1–4.
- Meehl, G. A., Washington, W. M., Amman, C. M., Arblaster, J. M., Wigley, T. M. L., and Tebaldi, C., “Combinations of Natural and Anthropogenic Forcings in Twentieth-Century Climate,” Journal of Climate 17 no. 3 (2004):721–3, 727; Scaffetta, N. and West, B. J., “Estimated Solar Contribution to the Global Surface Warming Using the ACRIM TSI Satellite Composite,” Geophysical Research Letters 32, L18713 (2005):1–4.
- Usoskin, I. G., Schüssler, M, Solanki, S. K., and Mursula, K., “Solar Activity, Cosmic Rays, and Earth’s Temperature: A Millennium-Scale Comparison,” Journal of Geophysical Research 110, A10102 (2005):1–10.
- Courtillot, V., Gallet, Y., Le Mouël, J.-L., Fluteau, F., and Genevey, A., “Are There Connections Between the Earth’s Magnetic Field and Climate?” Earth and Planetary Science Letters 253 (2007):328–339.
- Lean, J., “Living with a Variable Sun,” Physics Today 58 no. 6 (2005):32-38.
- RIAN, “Scientist Says Earth Could Soon Face New Ice Age,” Spero News, www.speroforum.com.
- Oard, M. J., The Frozen Record: Examining the Ice Core History of the Greenland and Antarctic Ice Sheets (Dallas: Institute for Creation Research, 2005).
- Loehle, C., “A 2000-Year Global Temperature Reconstruction Based on Non-tree Ring Proxies,” Energy and Environment 18 nos. 7 & 8 (2007):1,049–1,058.
- Loehle, C. and McCulloch, J. H., “Correction To: A 2000-Year Global Temperature Reconstruction Based on Non-tree Ring Proxies,” Energy and Environment 19 no. 1 (2008):93–100.
- Scafetta, N. and West, B. J., “Phenomenological Reconstructions of the Solar Signature in the Northern Hemisphere Surface Temperature Records Since 1600,” Journal of Geophysical Research 112, D24S03 (2007):1–10.
- Pasotti, J., “Daggers Are Drawn over Revived Cosmic Ray-Climate Link,” Science 319 (2008):144.
- Scafetta, N. and West, B. J., “Phenomenological Solar Contribution to the 1900–2000 Global Surface Warming,” Geophysical Research Letters 33, L05708 (2006):1–4.
- Scafetta, N. and West, B. J., “Is Climate Sensitive to Solar Variability?” Physics Today 61 no. 3 (2008):50–51.
- Scafetta and West, Ref. 19 p. 51.
- Oard, M. J., “Human-Caused Global Warming Slight So Far,” JOBSS, Answers in Genesis website.
- Oard, M. J. “Global Warming,” Answers, October–December 2006, pp. 24–26.


Support the creation/gospel message by donating or getting involved!

Answers in Genesis is an apologetics ministry, dedicated to helping Christians defend their faith and proclaim the good news of Jesus Christ.
- Customer Service 800.778.3390
- © 2024 Answers in Genesis